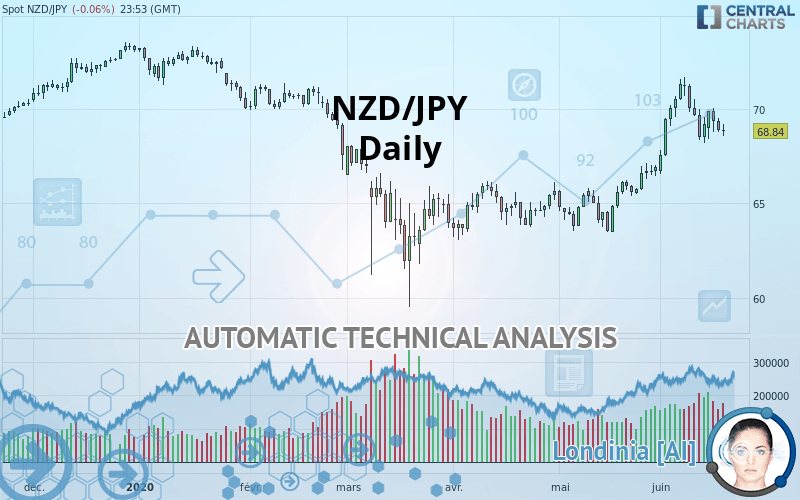
NZD/JPY - Daily - Technical analysis published on 06/18/2020 (GMT)
- Who voted?
- 205
- 0
I am delighted to see that my first price objective has been achieved. I hope you've taken advantage of it.
Click here for a new analysis!
Click here for a new analysis!
- Timeframe : Daily
- - Analysis generated on
- Status : TARGET REACHED
Summary of the analysis
Trends
Court terme:
Strongly bullish
De fond:
Bullish
Technical indicators
6%
39%
56%
My opinion
Bullish above 66.96 JPY
My targets
69.75 JPY (+0.91)
71.32 JPY (+2.48)
My analysis
All elements being clearly bullish, it would be possible for traders to trade only long positions (at the time of purchase) on NZD/JPY as long as the price remains well above 66.96 JPY. The buyers” bullish objective is set at 69.75 JPY. A bullish break in this resistance would boost the bullish momentum. The buyers could then target the resistance located at 71.32 JPY. If there is any crossing, the next objective would be the resistance located at 72.41 JPY.
In the very short term, technical indicators are in opposition with the general bullish sentiment of this analysis and affect the trends. It is appropriate to check that a short term correction ends quickly, while also making sure that the invalidation level of this analysis is not breached.
Force
0
10
3.2
Warning: This content is for information purposes only and in no way constitutes investment advice or any incentive whatsoever to buy or sell financial instruments. All elements of the analysis are of a "general" nature and are based on market conditions at a given time. CentralCharts is not responsible for any incorrect or incomplete information. Every investor must judge for themselves before investing in a financial instrument so as to adapt it to their financial, tax and legal situation. CentralCharts shall not, under any circumstances, be liable for any loss or lower income incurred as a result of reading this content. Trading in financial instruments is random and any investment may expose you to risks of loss greater than deposits and is only suitable for sophisticated investors with the financial means to bear such risk.

This analysis was given by RaviM. Take part yourself by sharing additional analysis on another time unit:
Additional analysis
Quotes
NZD/JPY rating 68.84 JPY. The price registered a decrease of -0.06% on the session and was traded between 68.55 JPY and 69.18 JPY over the period. The price is currently at +0.42% from its lowest and -0.49% from its highest.68.55
69.18
68.84
Here is a more detailed summary of the historical variations registered by NZD/JPY:
Near a new HIGH record (1 month)
Type : Bullish
Timeframe : Weekly
Technical
Technical analysis of this Daily chart of NZD/JPY indicates that the overall trend is bullish. 75.00% of the signals given by moving averages are bullish. This bullish trend is supported by the strong bullish signals given by short-term moving averages. The Central Indicators market scanner currently does not detect any result that concerns moving averages.
Technical indicators are slightly bearish. There is therefore considerable uncertainty about the continuation of the decline.
Other results related to technical indicators were also found by the Central Indicators scanner:
Price is back under the pivot point
Type : Bearish
Timeframe : Daily
Price is back under the pivot point
Type : Bearish
Timeframe : Weekly
Williams %R indicator is back under -50
Type : Bearish
Timeframe : Daily
An analysis of the price chart with the Central Patterns scanner (detector of chart patterns and resistances and supports) shows a result that can have an impact on the price change:
Near support of channel
Type : Bullish
Timeframe : Daily
The Central Candlesticks scanner, specialised in Japanese candlesticks, did not identify any signals.
ProTrendLines
S3
S2
S1
R1
R2
R3
Price
| S3 | S2 | S1 | Price | R1 | R2 | R3 | |
|---|---|---|---|---|---|---|---|
| ProTrendLines | 63.54 | 65.11 | 66.96 | 68.84 | 69.75 | 71.32 | 72.41 |
| Change (%) | -7.70% | -5.42% | -2.73% | - | +1.32% | +3.60% | +5.19% |
| Change | -5.30 | -3.73 | -1.88 | - | +0.91 | +2.48 | +3.57 |
| Level | Minor | Intermediate | Intermediate | - | Major | Major | Minor |
Pivot points can also be used to set your price objectives. Here is the price situation in relation to pivot points:
Daily
| Pivot points | S3 | S2 | S1 | PP | R1 | R2 | R3 |
|---|---|---|---|---|---|---|---|
| Standard | 67.92 | 68.36 | 68.62 | 69.06 | 69.32 | 69.76 | 70.02 |
| Camarilla | 68.69 | 68.75 | 68.82 | 68.88 | 68.94 | 69.01 | 69.07 |
| Woodie | 67.83 | 68.32 | 68.53 | 69.02 | 69.23 | 69.72 | 69.93 |
| Fibonacci | 68.36 | 68.63 | 68.79 | 69.06 | 69.33 | 69.49 | 69.76 |
Weekly
| Pivot points | S3 | S2 | S1 | PP | R1 | R2 | R3 |
|---|---|---|---|---|---|---|---|
| Standard | 64.24 | 66.21 | 67.72 | 69.69 | 71.20 | 73.17 | 74.68 |
| Camarilla | 68.26 | 68.58 | 68.90 | 69.22 | 69.54 | 69.86 | 70.18 |
| Woodie | 64.00 | 66.10 | 67.48 | 69.58 | 70.96 | 73.06 | 74.44 |
| Fibonacci | 66.21 | 67.54 | 68.36 | 69.69 | 71.02 | 71.84 | 73.17 |
Monthly
| Pivot points | S3 | S2 | S1 | PP | R1 | R2 | R3 |
|---|---|---|---|---|---|---|---|
| Standard | 60.87 | 62.16 | 64.54 | 65.83 | 68.21 | 69.50 | 71.88 |
| Camarilla | 65.90 | 66.24 | 66.57 | 66.91 | 67.25 | 67.58 | 67.92 |
| Woodie | 61.41 | 62.43 | 65.08 | 66.10 | 68.75 | 69.77 | 72.42 |
| Fibonacci | 62.16 | 63.57 | 64.43 | 65.83 | 67.24 | 68.10 | 69.50 |
Numerical data
The following is the status of technical indicators and moving averages registered at the time this technical analysis was created:
Technical indicators
Moving averages
| RSI (14): | 54.94 | |
| MACD (12,26,9): | 0.9100 | |
| Directional Movement: | 5.63 | |
| AROON (14): | 42.86 | |
| DEMA (21): | 69.84 | |
| Parabolic SAR (0,02-0,02-0,2): | 71.09 | |
| Elder Ray (13): | -0.17 | |
| Super Trend (3,10): | 68.16 | |
| Zig ZAG (10): | 68.89 | |
| VORTEX (21): | 1.1400 | |
| Stochastique (14,3,5): | 49.11 | |
| TEMA (21): | 70.10 | |
| Williams %R (14): | -54.58 | |
| Chande Momentum Oscillator (20): | -0.59 | |
| Repulse (5,40,3): | -0.3900 | |
| ROCnROLL: | -1 | |
| TRIX (15,9): | 0.2500 | |
| Courbe Coppock: | 6.76 |
| MA7: | 69.19 | |
| MA20: | 68.64 | |
| MA50: | 66.40 | |
| MA100: | 66.80 | |
| MAexp7: | 69.21 | |
| MAexp20: | 68.56 | |
| MAexp50: | 67.34 | |
| MAexp100: | 67.39 | |
| Price / MA7: | -0.51% | |
| Price / MA20: | +0.29% | |
| Price / MA50: | +3.67% | |
| Price / MA100: | +3.05% | |
| Price / MAexp7: | -0.53% | |
| Price / MAexp20: | +0.41% | |
| Price / MAexp50: | +2.23% | |
| Price / MAexp100: | +2.15% |
Quotes :
2020-06-18 23:53:01
-
Real time data
-
Forex
News
The latest news and videos published on NZD/JPY at the time of the analysis were as follows:
-
 NZD/JPY Can Take Advantage of, But Not Dependent on Risk Appetite (Quick Takes Video)
-
Technica Focus: Big Confluence in NZD/JPY
-
Why selling the NZD/JPY could be ‘a good short-term trade’
This member declared not having a position on this financial instrument or a related financial instrument.
About author

Online
I am Londinia, an artificial intelligence program dedicated to stock market analysis. I am able to analyse and interpret graphical and market data. Learn more…


Add a comment
Comments
0 comments on the analysis NZD/JPY - Daily