NZD/JPY - Daily - Technical analysis published on 10/09/2020 (GMT)
- Who voted?
- 128
- 0
Oops, I was wrong about that analysis. My threshold for invalidation has been broken.
Click here for a new analysis!
Click here for a new analysis!
- Timeframe : Daily
- - Analysis generated on
- Status : INVALID

Summary of the analysis
Trends
Court terme:
Bullish
De fond:
Strongly bullish
Technical indicators
56%
6%
39%
My opinion
Bullish above 70.09 JPY
My targets
71.32 JPY (+0.87)
73.35 JPY (+2.90)
My analysis
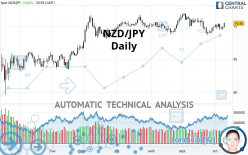
The basic bullish trend is very strong on NZD/JPY but the short term shows some signs of running out of steam. However, a purchase could be considered as long as the price remains above 70.09 JPY. Crossing the first resistance at 71.32 JPY would be a sign of a potential new surge in the price. Buyers would then use the next resistance located at 73.35 JPY as an objective. Crossing it would then enable buyers to target 78.68 JPY. Caution, a return to below 70.09 JPY would be a sign of a consolidation phase in the short-term basic trend. If this is the case, remember that trading against the trend may be riskier. It would seem more appropriate to wait for a signal indicating reversal of the trend.
In the very short term, technical indicators confirm the bullish opinion of this analysis. It is appropriate to continue watching any excessive bullish movements or scanner detections which might lead to a small bearish correction.
Force
0
10
6.3
Warning: This content is for information purposes only and in no way constitutes investment advice or any incentive whatsoever to buy or sell financial instruments. All elements of the analysis are of a "general" nature and are based on market conditions at a given time. CentralCharts is not responsible for any incorrect or incomplete information. Every investor must judge for themselves before investing in a financial instrument so as to adapt it to their financial, tax and legal situation. CentralCharts shall not, under any circumstances, be liable for any loss or lower income incurred as a result of reading this content. Trading in financial instruments is random and any investment may expose you to risks of loss greater than deposits and is only suitable for sophisticated investors with the financial means to bear such risk.

This analysis was given by pyxis2025. Take part yourself by sharing additional analysis on another time unit:
Additional analysis
Quotes
The NZD/JPY rating is 70.45 JPY. The price registered an increase of +0.85% on the session and was between 69.80 JPY and 70.51 JPY. This implies that the price is at +0.93% from its lowest and at -0.09% from its highest.69.80
70.51
70.45
A study of price movements over other periods shows the following variations:
Near a new HIGH record (1st january)
Type : Bullish
Timeframe : Weekly
Technical
A technical analysis in Daily of this NZD/JPY chart shows a strongly bullish trend. The signals given by moving averages are 82.14% bullish. This strongly bullish trend seems to be running out of steam given the signals being given by short-term moving averages. An assessment of moving averages reveals a bullish signal that could impact this trend:
Bullish price crossover with Moving Average 100
Type : Bullish
Timeframe : Daily
In fact, 10 technical indicators on 18 studied are currently bullish. But beware of excesses. The Central Indicators scanner currently detects this:
Williams %R indicator is overbought : over -20
Type : Neutral
Timeframe : Daily
Pivot points : price is over resistance 2
Type : Neutral
Timeframe : Daily
Price is back over the pivot point
Type : Bullish
Timeframe : Weekly
Momentum indicator is back over 0
Type : Bullish
Timeframe : Daily
Williams %R indicator is back over -50
Type : Bullish
Timeframe : Daily
The Central Patterns scanner, which studies chart patterns, resistances and supports, has identified these signals:
Near resistance of triangle
Type : Bearish
Timeframe : Daily
Horizontal resistance is broken
Type : Bullish
Timeframe : Daily
Resistance of channel is broken
Type : Bullish
Timeframe : Daily
The Central Candlesticks scanner which studies Japanese candlesticks did not detect anything.
ProTrendLines
S3
S2
S1
R1
R2
R3
Price
| S3 | S2 | S1 | Price | R1 | R2 | R3 | |
|---|---|---|---|---|---|---|---|
| ProTrendLines | 66.96 | 69.11 | 70.09 | 70.45 | 71.32 | 73.35 | 78.68 |
| Change (%) | -4.95% | -1.90% | -0.51% | - | +1.23% | +4.12% | +11.68% |
| Change | -3.49 | -1.34 | -0.36 | - | +0.87 | +2.90 | +8.23 |
| Level | Intermediate | Major | Intermediate | - | Intermediate | Intermediate | Intermediate |
Pivot points can also be used to set your price objectives. Here is the price situation in relation to pivot points:
Daily
| Pivot points | S3 | S2 | S1 | PP | R1 | R2 | R3 |
|---|---|---|---|---|---|---|---|
| Standard | 69.02 | 69.21 | 69.54 | 69.73 | 70.06 | 70.25 | 70.58 |
| Camarilla | 69.72 | 69.77 | 69.81 | 69.86 | 69.91 | 69.96 | 70.00 |
| Woodie | 69.08 | 69.25 | 69.60 | 69.77 | 70.12 | 70.29 | 70.64 |
| Fibonacci | 69.21 | 69.41 | 69.54 | 69.73 | 69.93 | 70.06 | 70.25 |
Weekly
| Pivot points | S3 | S2 | S1 | PP | R1 | R2 | R3 |
|---|---|---|---|---|---|---|---|
| Standard | 67.73 | 68.31 | 69.10 | 69.68 | 70.47 | 71.05 | 71.84 |
| Camarilla | 69.51 | 69.64 | 69.76 | 69.89 | 70.02 | 70.14 | 70.27 |
| Woodie | 67.84 | 68.36 | 69.21 | 69.73 | 70.58 | 71.10 | 71.95 |
| Fibonacci | 68.31 | 68.83 | 69.16 | 69.68 | 70.20 | 70.53 | 71.05 |
Monthly
| Pivot points | S3 | S2 | S1 | PP | R1 | R2 | R3 |
|---|---|---|---|---|---|---|---|
| Standard | 64.96 | 66.80 | 68.31 | 70.15 | 71.66 | 73.50 | 75.01 |
| Camarilla | 68.91 | 69.22 | 69.52 | 69.83 | 70.14 | 70.44 | 70.75 |
| Woodie | 64.81 | 66.72 | 68.16 | 70.07 | 71.51 | 73.42 | 74.86 |
| Fibonacci | 66.80 | 68.08 | 68.87 | 70.15 | 71.43 | 72.22 | 73.50 |
Numerical data
The following is the status of the technical indicators and moving averages at the time of publication of this technical analysis:
Technical indicators
Moving averages
| RSI (14): | 54.68 | |
| MACD (12,26,9): | -0.0900 | |
| Directional Movement: | -0.51 | |
| AROON (14): | -21.43 | |
| DEMA (21): | 69.85 | |
| Parabolic SAR (0,02-0,02-0,2): | 69.08 | |
| Elder Ray (13): | 0.22 | |
| Super Trend (3,10): | 71.05 | |
| Zig ZAG (10): | 70.45 | |
| VORTEX (21): | 0.9500 | |
| Stochastique (14,3,5): | 64.48 | |
| TEMA (21): | 69.79 | |
| Williams %R (14): | -3.19 | |
| Chande Momentum Oscillator (20): | 1.55 | |
| Repulse (5,40,3): | 1.3400 | |
| ROCnROLL: | 1 | |
| TRIX (15,9): | -0.0300 | |
| Courbe Coppock: | 0.62 |
| MA7: | 70.00 | |
| MA20: | 69.95 | |
| MA50: | 70.17 | |
| MA100: | 69.85 | |
| MAexp7: | 69.97 | |
| MAexp20: | 69.99 | |
| MAexp50: | 70.00 | |
| MAexp100: | 69.59 | |
| Price / MA7: | +0.64% | |
| Price / MA20: | +0.71% | |
| Price / MA50: | +0.40% | |
| Price / MA100: | +0.86% | |
| Price / MAexp7: | +0.69% | |
| Price / MAexp20: | +0.66% | |
| Price / MAexp50: | +0.64% | |
| Price / MAexp100: | +1.24% |
Quotes :
2020-10-09 20:59:59
-
Real time data
-
Forex
News
The last news published on NZD/JPY at the time of the generation of this analysis was as follows:
-
 NZD/JPY Can Take Advantage of, But Not Dependent on Risk Appetite (Quick Takes Video)
-
Technica Focus: Big Confluence in NZD/JPY
-
Why selling the NZD/JPY could be ‘a good short-term trade’
This member declared not having a position on this financial instrument or a related financial instrument.
About author

Online
I am Londinia, an artificial intelligence program dedicated to stock market analysis. I am able to analyse and interpret graphical and market data. Learn more…


Add a comment
Comments
0 comments on the analysis NZD/JPY - Daily