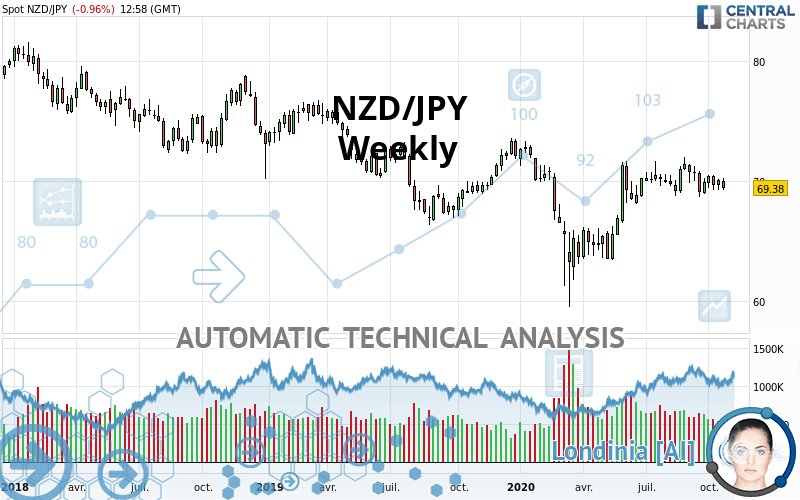
NZD/JPY - Weekly - Technical analysis published on 10/28/2020 (GMT)
- 102
- 0
Click here for a new analysis!
- Timeframe : Weekly
- - Analysis generated on
- Status : INVALID

Summary of the analysis

Additional analysis
Quotes
The NZD/JPY price is 69.38 JPY. The price registered a decrease of -0.24% over 5 days and has been traded over the last 5 days between 69.88 JPY and 70.28 JPY. This implies that the 5 day price is -0.72% from its lowest point and -1.28% from its highest point.Here is a more detailed summary of the historical variations registered by NZD/JPY:
Near a new HIGH record (5 years)
Type : Bullish
Timeframe : Weekly
Near a new HIGH record (1st january)
Type : Bullish
Timeframe : Weekly
Near a new HIGH record (1 month)
Type : Bullish
Timeframe : Weekly
Technical
Technical analysis of NZD/JPY in Weekly shows an overall bearish trend. 71.43% of the signals given by moving averages are bearish. Caution: as the signals currently given by short-term moving averages are rather neutral, the bearish trend could slow down. An assessment of moving averages reveals several bullish signals that could impact this trend:
Moving Average bullish crossovers : AMA20 & AMA50
Type : Bullish
Timeframe : Weekly
Bullish price crossover with Moving Average 20
Type : Bullish
Timeframe : Weekly
Bullish price crossover with Moving Average 100
Type : Bullish
Timeframe : Weekly
Bullish price crossover with adaptative moving average 50
Type : Bullish
Timeframe : Weekly
Bullish price crossover with adaptative moving average 100
Type : Bullish
Timeframe : Weekly
An assessment of technical indicators does not currently provide any relevant information on the direction of future price movements.
Caution: the Central Indicators scanner currently detects an excess:
RSI indicator is overbought : over 70
Type : Neutral
Timeframe : Weekly
CCI indicator is overbought : over 100
Type : Neutral
Timeframe : Weekly
Williams %R indicator is overbought : over -20
Type : Neutral
Timeframe : Weekly
Pivot points : price is under support 3
Type : Neutral
Timeframe : Weekly
MACD crosses UP its Moving Average
Type : Bullish
Timeframe : Weekly
Parabolic SAR indicator bullish reversal
Type : Bullish
Timeframe : Weekly
Aroon indicator bullish trend
Type : Bullish
Timeframe : Weekly
Price is back over the pivot point
Type : Bullish
Timeframe : Weekly
Williams %R indicator is back over -50
Type : Bullish
Timeframe : Weekly
Central Patterns, the scanner specializing in chart patterns, did not identify any signals.
No result was found by the Central Candlesticks scanner on Japanese candlesticks.
| S3 | S2 | S1 | Price | R1 | R2 | R3 | |
|---|---|---|---|---|---|---|---|
| ProTrendLines | 61.93 | 66.96 | 68.94 | 69.38 | 71.32 | 73.35 | 78.68 |
| Change (%) | -10.74% | -3.49% | -0.63% | - | +2.80% | +5.72% | +13.40% |
| Change | -7.45 | -2.42 | -0.44 | - | +1.94 | +3.97 | +9.30 |
| Level | Major | Intermediate | Intermediate | - | Intermediate | Intermediate | Intermediate |
Pivot points can also be used to set your price objectives. Here is the price situation in relation to pivot points:
| Pivot points | S3 | S2 | S1 | PP | R1 | R2 | R3 |
|---|---|---|---|---|---|---|---|
| Standard | 69.58 | 69.74 | 69.90 | 70.06 | 70.22 | 70.38 | 70.54 |
| Camarilla | 69.96 | 69.99 | 70.02 | 70.05 | 70.08 | 70.11 | 70.14 |
| Woodie | 69.57 | 69.74 | 69.89 | 70.06 | 70.21 | 70.38 | 70.53 |
| Fibonacci | 69.74 | 69.87 | 69.94 | 70.06 | 70.19 | 70.26 | 70.38 |
| Pivot points | S3 | S2 | S1 | PP | R1 | R2 | R3 |
|---|---|---|---|---|---|---|---|
| Standard | 76.20 | 77.96 | 79.62 | 81.38 | 83.04 | 84.80 | 86.46 |
| Camarilla | 80.33 | 80.64 | 80.96 | 81.27 | 81.58 | 81.90 | 82.21 |
| Woodie | 76.14 | 77.94 | 79.56 | 81.36 | 82.98 | 84.78 | 86.40 |
| Fibonacci | 77.96 | 79.27 | 80.08 | 81.38 | 82.69 | 83.50 | 84.80 |
| Pivot points | S3 | S2 | S1 | PP | R1 | R2 | R3 |
|---|---|---|---|---|---|---|---|
| Standard | 68.93 | 69.16 | 69.57 | 69.80 | 70.21 | 70.44 | 70.85 |
| Camarilla | 69.80 | 69.86 | 69.92 | 69.98 | 70.04 | 70.10 | 70.16 |
| Woodie | 69.02 | 69.21 | 69.66 | 69.85 | 70.30 | 70.49 | 70.94 |
| Fibonacci | 69.16 | 69.40 | 69.56 | 69.80 | 70.04 | 70.20 | 70.44 |
Numerical data
The following is the status of the technical indicators and moving averages at the time of publication of this technical analysis:
| RSI (14): | 48.59 | |
| MACD (12,26,9): | 1.0200 | |
| Directional Movement: | 3.22 | |
| AROON (14): | 42.86 | |
| DEMA (21): | 71.87 | |
| Parabolic SAR (0,02-0,02-0,2): | 68.92 | |
| Elder Ray (13): | -1.45 | |
| Super Trend (3,10): | 80.32 | |
| Zig ZAG (10): | 69.38 | |
| VORTEX (21): | 0.9800 | |
| Stochastique (14,3,5): | 44.03 | |
| TEMA (21): | 72.65 | |
| Williams %R (14): | -95.39 | |
| Chande Momentum Oscillator (20): | 0.09 | |
| Repulse (5,40,3): | -2.5500 | |
| ROCnROLL: | 2 | |
| TRIX (15,9): | 0.1600 | |
| Courbe Coppock: | 4.83 |
| MA7: | 69.80 | |
| MA20: | 69.84 | |
| MA50: | 70.14 | |
| MA100: | 70.01 | |
| MAexp7: | 71.97 | |
| MAexp20: | 70.68 | |
| MAexp50: | 69.99 | |
| MAexp100: | 70.94 | |
| Price / MA7: | -0.60% | |
| Price / MA20: | -0.66% | |
| Price / MA50: | -1.08% | |
| Price / MA100: | -0.90% | |
| Price / MAexp7: | -3.60% | |
| Price / MAexp20: | -1.84% | |
| Price / MAexp50: | -0.87% | |
| Price / MAexp100: | -2.20% |
News
The latest news and videos published on NZD/JPY at the time of the analysis were as follows:
-
 NZD/JPY Can Take Advantage of, But Not Dependent on Risk Appetite (Quick Takes Video)
-
Technica Focus: Big Confluence in NZD/JPY
-
Why selling the NZD/JPY could be ‘a good short-term trade’
About author

Online


Add a comment
Comments
0 comments on the analysis NZD/JPY - Weekly