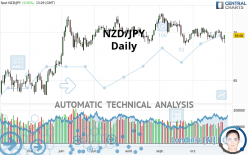
NZD/JPY - Daily - Technical analysis published on 10/30/2020 (GMT)
- 113
- 0
Click here for a new analysis!
- Timeframe : Daily
- - Analysis generated on
- Status : TARGET REACHED

Summary of the analysis

Additional analysis
Quotes
The NZD/JPY price is 69.66 JPY. The price registered an increase of +0.51% on the session and was traded between 68.86 JPY and 69.70 JPY over the period. The price is currently at +1.16% from its lowest and -0.06% from its highest.The Central Gaps scanner detects a bearish opening. A small advantage for sellers in the very short term.
Bearish opening
Type : Bearish
Timeframe : Openning
So that you have an overall view of the price change, here is a table showing the variations over several periods:
Near a new HIGH record (1st january)
Type : Bullish
Timeframe : Weekly
Near a new HIGH record (1 month)
Type : Bullish
Timeframe : Weekly
Technical
A technical analysis in Daily of this NZD/JPY chart shows a slightly bearish trend. Only 60.71% of the signals given by moving averages are bearish. This slightly bearish trend is reinforced by the strong signals currently being given by short-term moving averages. The Central Indicators scanner does not detect any result on moving averages that would impact this trend.
In fact, only 8 technical indicators out of 18 studied are currently positioned bearish. But beware of excesses. The Central Indicators scanner currently detects this:
CCI indicator is oversold : under -100
Type : Neutral
Timeframe : Daily
Pivot points : price is under support 3
Type : Neutral
Timeframe : Weekly
MACD crosses DOWN its Moving Average
Type : Bearish
Timeframe : Daily
Ichimoku - Bullish crossover : Tenkan & Kijun
Type : Bullish
Timeframe : Daily
Ichimoku - Bearish crossover : Tenkan & Kijun
Type : Bearish
Timeframe : Daily
Price is back over the pivot point
Type : Bullish
Timeframe : Weekly
Central Patterns, the market scanner focusing on chart patterns, resistances and supports found these results:
Near horizontal support
Type : Bullish
Timeframe : Daily
Support of channel is broken
Type : Bearish
Timeframe : Daily
Support of triangle is broken
Type : Bearish
Timeframe : Daily
The Central Candlesticks scanner which studies Japanese candlesticks did not detect anything.
| S3 | S2 | S1 | Price | R1 | R2 | R3 | |
|---|---|---|---|---|---|---|---|
| ProTrendLines | 65.96 | 66.96 | 68.94 | 69.66 | 70.49 | 71.32 | 73.35 |
| Change (%) | -5.31% | -3.88% | -1.03% | - | +1.19% | +2.38% | +5.30% |
| Change | -3.70 | -2.70 | -0.72 | - | +0.83 | +1.66 | +3.69 |
| Level | Intermediate | Intermediate | Major | - | Minor | Intermediate | Intermediate |
Attention could also be paid to pivot points to set price objectives:
| Pivot points | S3 | S2 | S1 | PP | R1 | R2 | R3 |
|---|---|---|---|---|---|---|---|
| Standard | 68.45 | 68.71 | 69.01 | 69.27 | 69.57 | 69.83 | 70.13 |
| Camarilla | 69.16 | 69.21 | 69.26 | 69.31 | 69.36 | 69.41 | 69.46 |
| Woodie | 68.47 | 68.72 | 69.03 | 69.28 | 69.59 | 69.84 | 70.15 |
| Fibonacci | 68.71 | 68.92 | 69.06 | 69.27 | 69.48 | 69.62 | 69.83 |
| Pivot points | S3 | S2 | S1 | PP | R1 | R2 | R3 |
|---|---|---|---|---|---|---|---|
| Standard | 76.20 | 77.96 | 79.62 | 81.38 | 83.04 | 84.80 | 86.46 |
| Camarilla | 80.33 | 80.64 | 80.96 | 81.27 | 81.58 | 81.90 | 82.21 |
| Woodie | 76.14 | 77.94 | 79.56 | 81.36 | 82.98 | 84.78 | 86.40 |
| Fibonacci | 77.96 | 79.27 | 80.08 | 81.38 | 82.69 | 83.50 | 84.80 |
| Pivot points | S3 | S2 | S1 | PP | R1 | R2 | R3 |
|---|---|---|---|---|---|---|---|
| Standard | 68.93 | 69.16 | 69.57 | 69.80 | 70.21 | 70.44 | 70.85 |
| Camarilla | 69.80 | 69.86 | 69.92 | 69.98 | 70.04 | 70.10 | 70.16 |
| Woodie | 69.02 | 69.21 | 69.66 | 69.85 | 70.30 | 70.49 | 70.94 |
| Fibonacci | 69.16 | 69.40 | 69.56 | 69.80 | 70.04 | 70.20 | 70.44 |
Numerical data
The following is the status of technical indicators and moving averages registered at the time this technical analysis was created:
| RSI (14): | 48.11 | |
| MACD (12,26,9): | -0.1100 | |
| Directional Movement: | -8.81 | |
| AROON (14): | -92.86 | |
| DEMA (21): | 69.61 | |
| Parabolic SAR (0,02-0,02-0,2): | 70.15 | |
| Elder Ray (13): | -0.42 | |
| Super Trend (3,10): | 71.05 | |
| Zig ZAG (10): | 69.65 | |
| VORTEX (21): | 0.9200 | |
| Stochastique (14,3,5): | 23.35 | |
| TEMA (21): | 69.49 | |
| Williams %R (14): | -70.00 | |
| Chande Momentum Oscillator (20): | -0.20 | |
| Repulse (5,40,3): | -0.1700 | |
| ROCnROLL: | 2 | |
| TRIX (15,9): | -0.0200 | |
| Courbe Coppock: | 0.99 |
| MA7: | 69.67 | |
| MA20: | 69.77 | |
| MA50: | 70.15 | |
| MA100: | 70.01 | |
| MAexp7: | 69.55 | |
| MAexp20: | 69.76 | |
| MAexp50: | 69.87 | |
| MAexp100: | 69.62 | |
| Price / MA7: | -0.01% | |
| Price / MA20: | -0.16% | |
| Price / MA50: | -0.70% | |
| Price / MA100: | -0.50% | |
| Price / MAexp7: | +0.16% | |
| Price / MAexp20: | -0.14% | |
| Price / MAexp50: | -0.30% | |
| Price / MAexp100: | +0.06% |
News
Don"t forget to follow the news on NZD/JPY. At the time of publication of this analysis, the latest news was as follows:
-
 NZD/JPY Can Take Advantage of, But Not Dependent on Risk Appetite (Quick Takes Video)
-
Technica Focus: Big Confluence in NZD/JPY
-
Why selling the NZD/JPY could be ‘a good short-term trade’
About author

Online


Add a comment
Comments
0 comments on the analysis NZD/JPY - Daily