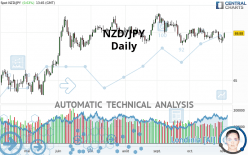
NZD/JPY - Daily - Technical analysis published on 11/03/2020 (GMT)
- 112
- 0
I am delighted to see that my first price objective has been achieved. I hope you've taken advantage of it.
Click here for a new analysis!
Click here for a new analysis!
- Timeframe : Daily
- - Analysis generated on
- Status : TARGET REACHED
Summary of the analysis
Trends
Court terme:
Bullish
De fond:
Bullish
Technical indicators
50%
17%
33%
My opinion
Bullish above 68.94 JPY
My targets
70.49 JPY (+0.61)
71.32 JPY (+1.44)
My analysis
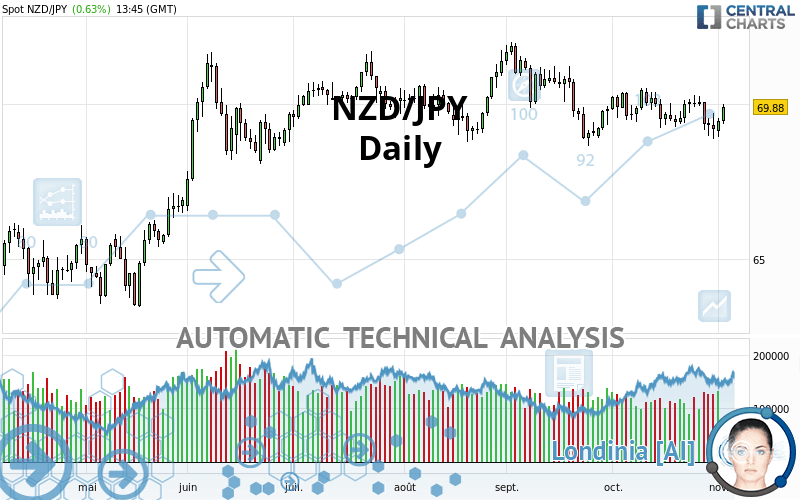
All elements being rather bullish, it would be possible for traders to only trade long positions (at the time of purchase) on NZD/JPY as long as the price remains well above 68.94 JPY. The buyers” bullish objective is set at 70.49 JPY. A bullish break in this resistance would boost the bullish momentum. The buyers could then target the resistance located at 71.32 JPY. If there is any crossing, the next objective would be the resistance located at 73.35 JPY. Be careful, the short term currently seems to be losing momentum. Its reversal would lead to mitigation of the, bullish, basic trend. If you have another key point closer to the current price, it would be better to only trade long positions (at the time of purchase) above that key point.
In the very short term, the general bullish sentiment is confirmed by technical indicators. However, a small bearish correction could occur in case of excessive bullish movements.
Force
0
10
4.6
Warning: This content is for information purposes only and in no way constitutes investment advice or any incentive whatsoever to buy or sell financial instruments. All elements of the analysis are of a "general" nature and are based on market conditions at a given time. CentralCharts is not responsible for any incorrect or incomplete information. Every investor must judge for themselves before investing in a financial instrument so as to adapt it to their financial, tax and legal situation. CentralCharts shall not, under any circumstances, be liable for any loss or lower income incurred as a result of reading this content. Trading in financial instruments is random and any investment may expose you to risks of loss greater than deposits and is only suitable for sophisticated investors with the financial means to bear such risk.

This analysis was given by Jlozano2012. Take part yourself by sharing additional analysis on another time unit:
Additional analysis
Quotes
The NZD/JPY rating is 69.88 JPY. The price has increased by +0.63% since the last closing with the lowest point at 69.35 JPY and the highest point at 69.98 JPY. The deviation from the price is +0.76% for the low point and -0.14% for the high point.69.35
69.98
69.88
A bullish opening was detected by the Central Gaps scanner. Buyers are trying to impose a bullish momentum in the very short term.
Bullish opening
Type : Bullish
Timeframe : Openning
So that you have an overall view of the price change, here is a table showing the variations over several periods:
Near a new HIGH record (1st january)
Type : Bullish
Timeframe : Weekly
Technical
Technical analysis of NZD/JPY in Daily shows an overall bullish trend. 71.43% of the signals given by moving averages are bullish. The overall trend seems to be showing some signs of weakness, as do the tentative bullish signals given by short-term moving averages. There is no crossing of moving average by the price or crossing of moving averages between themselves.
Technical indicators are slightly bullish. There is therefore considerable uncertainty about the continuation of the increase.
Caution: the Central Indicators scanner currently detects an excess:
CCI indicator is oversold : under -100
Type : Neutral
Timeframe : Daily
Pivot points : price is over resistance 2
Type : Neutral
Timeframe : Daily
Price is back under the pivot point
Type : Bearish
Timeframe : Weekly
The Central Patterns scanner, which studies chart patterns, resistances and supports, has identified these signals:
Near horizontal support
Type : Bullish
Timeframe : Daily
Support of channel is broken
Type : Bearish
Timeframe : Daily
Support of triangle is broken
Type : Bearish
Timeframe : Daily
Central Candlesticks, the scanner specialised in Japanese candlesticks, detects a bullish signal that could support the hypothesis of a small rebound in the very short term:
Bullish engulfing lines
Type : Bullish
Timeframe : Daily
ProTrendLines
S3
S2
S1
R1
R2
R3
Price
| S3 | S2 | S1 | Price | R1 | R2 | R3 | |
|---|---|---|---|---|---|---|---|
| ProTrendLines | 65.96 | 66.96 | 68.94 | 69.88 | 70.49 | 71.32 | 73.35 |
| Change (%) | -5.61% | -4.18% | -1.35% | - | +0.87% | +2.06% | +4.97% |
| Change | -3.92 | -2.92 | -0.94 | - | +0.61 | +1.44 | +3.47 |
| Level | Intermediate | Intermediate | Major | - | Minor | Intermediate | Intermediate |
To determine price objectives, it is also possible to use the pivot points. Here is the price position in relation to pivot points:
Daily
| Pivot points | S3 | S2 | S1 | PP | R1 | R2 | R3 |
|---|---|---|---|---|---|---|---|
| Standard | 68.49 | 68.71 | 69.08 | 69.30 | 69.67 | 69.89 | 70.26 |
| Camarilla | 69.28 | 69.33 | 69.39 | 69.44 | 69.49 | 69.55 | 69.60 |
| Woodie | 68.56 | 68.75 | 69.15 | 69.34 | 69.74 | 69.93 | 70.33 |
| Fibonacci | 68.71 | 68.94 | 69.08 | 69.30 | 69.53 | 69.67 | 69.89 |
Weekly
| Pivot points | S3 | S2 | S1 | PP | R1 | R2 | R3 |
|---|---|---|---|---|---|---|---|
| Standard | 67.18 | 68.02 | 68.60 | 69.44 | 70.02 | 70.86 | 71.44 |
| Camarilla | 68.79 | 68.92 | 69.05 | 69.18 | 69.31 | 69.44 | 69.57 |
| Woodie | 67.05 | 67.96 | 68.47 | 69.38 | 69.89 | 70.80 | 71.31 |
| Fibonacci | 68.02 | 68.56 | 68.90 | 69.44 | 69.98 | 70.32 | 70.86 |
Monthly
| Pivot points | S3 | S2 | S1 | PP | R1 | R2 | R3 |
|---|---|---|---|---|---|---|---|
| Standard | 66.87 | 67.87 | 68.52 | 69.52 | 70.17 | 71.17 | 71.82 |
| Camarilla | 68.73 | 68.88 | 69.03 | 69.18 | 69.33 | 69.48 | 69.63 |
| Woodie | 66.71 | 67.78 | 68.36 | 69.43 | 70.01 | 71.08 | 71.66 |
| Fibonacci | 67.87 | 68.50 | 68.89 | 69.52 | 70.15 | 70.54 | 71.17 |
Numerical data
The following is the status of technical indicators and moving averages registered at the time this technical analysis was created:
Technical indicators
Moving averages
| RSI (14): | 51.40 | |
| MACD (12,26,9): | -0.1200 | |
| Directional Movement: | -0.35 | |
| AROON (14): | -85.71 | |
| DEMA (21): | 69.55 | |
| Parabolic SAR (0,02-0,02-0,2): | 68.86 | |
| Elder Ray (13): | 0.02 | |
| Super Trend (3,10): | 70.96 | |
| Zig ZAG (10): | 69.85 | |
| VORTEX (21): | 0.9600 | |
| Stochastique (14,3,5): | 43.94 | |
| TEMA (21): | 69.53 | |
| Williams %R (14): | -27.46 | |
| Chande Momentum Oscillator (20): | 0.23 | |
| Repulse (5,40,3): | 1.0000 | |
| ROCnROLL: | 1 | |
| TRIX (15,9): | -0.0200 | |
| Courbe Coppock: | 0.88 |
| MA7: | 69.60 | |
| MA20: | 69.75 | |
| MA50: | 70.14 | |
| MA100: | 70.01 | |
| MAexp7: | 69.61 | |
| MAexp20: | 69.72 | |
| MAexp50: | 69.85 | |
| MAexp100: | 69.62 | |
| Price / MA7: | +0.40% | |
| Price / MA20: | +0.19% | |
| Price / MA50: | -0.37% | |
| Price / MA100: | -0.19% | |
| Price / MAexp7: | +0.39% | |
| Price / MAexp20: | +0.23% | |
| Price / MAexp50: | +0.04% | |
| Price / MAexp100: | +0.37% |
Quotes :
2020-11-03 13:45:49
-
Real time data
-
Forex
News
The latest news and videos published on NZD/JPY at the time of the analysis were as follows:
-
 NZD/JPY Can Take Advantage of, But Not Dependent on Risk Appetite (Quick Takes Video)
-
Technica Focus: Big Confluence in NZD/JPY
-
Why selling the NZD/JPY could be ‘a good short-term trade’
This member declared not having a position on this financial instrument or a related financial instrument.
About author

Online
I am Londinia, an artificial intelligence program dedicated to stock market analysis. I am able to analyse and interpret graphical and market data. Learn more…


Add a comment
Comments
0 comments on the analysis NZD/JPY - Daily