NZD/JPY - Daily - Technical analysis published on 11/04/2020 (GMT)
- 116
- 0
Click here for a new analysis!
- Timeframe : Daily
- - Analysis generated on
- Status : TARGET REACHED
Summary of the analysis

Additional analysis
Quotes
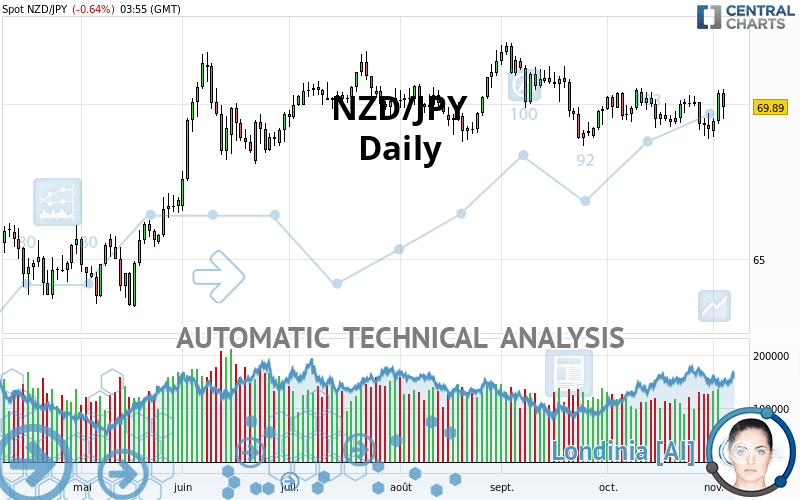
The NZD/JPY rating is 69.89 JPY. The price is lower by -0.64% since the last closing with the lowest point at 69.50 JPY and the highest point at 70.48 JPY. The deviation from the price is +0.56% for the low point and -0.84% for the high point.A study of price movements over other periods shows the following variations:
Near a new HIGH record (1st january)
Type : Bullish
Timeframe : Weekly
Technical
A technical analysis in Daily of this NZD/JPY chart shows a slightly bullish trend. 57.14% of the signals given by moving averages are bullish. The overall trend remains fragile, as do the slightly bullish signals given by short-term moving averages. The Central Indicators market scanner is currently detecting several bullish signals that could impact this trend:
Bullish trend reversal : Moving Average 20
Type : Bullish
Timeframe : Daily
Bullish trend reversal : Moving Average 100
Type : Bullish
Timeframe : Daily
Bullish trend reversal : adaptative moving average 20
Type : Bullish
Timeframe : Daily
Bullish trend reversal : adaptative moving average 50
Type : Bullish
Timeframe : Daily
Bullish trend reversal : adaptative moving average 100
Type : Bullish
Timeframe : Daily
Bullish price crossover with Moving Average 20
Type : Bullish
Timeframe : Daily
Bullish price crossover with Moving Average 50
Type : Bullish
Timeframe : Daily
Bullish price crossover with Moving Average 100
Type : Bullish
Timeframe : Daily
Bullish price crossover with adaptative moving average 20
Type : Bullish
Timeframe : Daily
Bullish price crossover with adaptative moving average 50
Type : Bullish
Timeframe : Daily
In fact, 10 technical indicators on 18 studied are currently positioned bullish. Central Indicators, the scanner specialised in technical indicators, has identified these signals:
Pivot points : price is over resistance 1
Type : Neutral
Timeframe : Weekly
RSI indicator is back over 50
Type : Bullish
Timeframe : Daily
MACD crosses UP its Moving Average
Type : Bullish
Timeframe : Daily
Parabolic SAR indicator bullish reversal
Type : Bullish
Timeframe : Daily
Aroon indicator bullish trend
Type : Bullish
Timeframe : Daily
Ichimoku : price is over the cloud
Type : Bullish
Timeframe : Daily
Price is back over the pivot point
Type : Bullish
Timeframe : Daily
Price is back under the pivot point
Type : Bearish
Timeframe : Weekly
Momentum indicator is back over 0
Type : Bullish
Timeframe : Daily
Williams %R indicator is back over -50
Type : Bullish
Timeframe : Daily
An analysis of the price chart with the Central Patterns scanner (detector of chart patterns and resistances and supports) shows a result that can have an impact on the price change:
Support of triangle is broken
Type : Bearish
Timeframe : Daily
No result was found by the Central Candlesticks scanner on Japanese candlesticks.
| S3 | S2 | S1 | Price | R1 | R2 | R3 | |
|---|---|---|---|---|---|---|---|
| ProTrendLines | 65.96 | 66.96 | 68.94 | 69.89 | 70.08 | 71.32 | 73.35 |
| Change (%) | -5.62% | -4.19% | -1.36% | - | +0.27% | +2.05% | +4.95% |
| Change | -3.93 | -2.93 | -0.95 | - | +0.19 | +1.43 | +3.46 |
| Level | Minor | Intermediate | Intermediate | - | Major | Intermediate | Intermediate |
Pivot points can also be used to set your price objectives. Here is the price situation in relation to pivot points:
| Pivot points | S3 | S2 | S1 | PP | R1 | R2 | R3 |
|---|---|---|---|---|---|---|---|
| Standard | 68.57 | 68.96 | 69.65 | 70.04 | 70.73 | 71.12 | 71.81 |
| Camarilla | 70.04 | 70.14 | 70.24 | 70.34 | 70.44 | 70.54 | 70.64 |
| Woodie | 68.72 | 69.04 | 69.80 | 70.12 | 70.88 | 71.20 | 71.96 |
| Fibonacci | 68.96 | 69.37 | 69.63 | 70.04 | 70.45 | 70.71 | 71.12 |
| Pivot points | S3 | S2 | S1 | PP | R1 | R2 | R3 |
|---|---|---|---|---|---|---|---|
| Standard | 67.18 | 68.02 | 68.60 | 69.44 | 70.02 | 70.86 | 71.44 |
| Camarilla | 68.79 | 68.92 | 69.05 | 69.18 | 69.31 | 69.44 | 69.57 |
| Woodie | 67.05 | 67.96 | 68.47 | 69.38 | 69.89 | 70.80 | 71.31 |
| Fibonacci | 68.02 | 68.56 | 68.90 | 69.44 | 69.98 | 70.32 | 70.86 |
| Pivot points | S3 | S2 | S1 | PP | R1 | R2 | R3 |
|---|---|---|---|---|---|---|---|
| Standard | 66.87 | 67.87 | 68.52 | 69.52 | 70.17 | 71.17 | 71.82 |
| Camarilla | 68.73 | 68.88 | 69.03 | 69.18 | 69.33 | 69.48 | 69.63 |
| Woodie | 66.71 | 67.78 | 68.36 | 69.43 | 70.01 | 71.08 | 71.66 |
| Fibonacci | 67.87 | 68.50 | 68.89 | 69.52 | 70.15 | 70.54 | 71.17 |
Numerical data
The following are the details of the technical indicators and moving averages that were collected to generate this technical analysis:
| RSI (14): | 49.38 | |
| MACD (12,26,9): | -0.0700 | |
| Directional Movement: | 4.78 | |
| AROON (14): | 21.43 | |
| DEMA (21): | 69.67 | |
| Parabolic SAR (0,02-0,02-0,2): | 68.89 | |
| Elder Ray (13): | 0.23 | |
| Super Trend (3,10): | 70.96 | |
| Zig ZAG (10): | 69.90 | |
| VORTEX (21): | 1.0000 | |
| Stochastique (14,3,5): | 66.53 | |
| TEMA (21): | 69.71 | |
| Williams %R (14): | -34.57 | |
| Chande Momentum Oscillator (20): | 0.43 | |
| Repulse (5,40,3): | 0.8100 | |
| ROCnROLL: | 1 | |
| TRIX (15,9): | -0.0200 | |
| Courbe Coppock: | 0.28 |
| MA7: | 69.69 | |
| MA20: | 69.79 | |
| MA50: | 70.14 | |
| MA100: | 70.02 | |
| MAexp7: | 69.82 | |
| MAexp20: | 69.77 | |
| MAexp50: | 69.86 | |
| MAexp100: | 69.63 | |
| Price / MA7: | +0.29% | |
| Price / MA20: | +0.14% | |
| Price / MA50: | -0.36% | |
| Price / MA100: | -0.19% | |
| Price / MAexp7: | +0.11% | |
| Price / MAexp20: | +0.19% | |
| Price / MAexp50: | +0.06% | |
| Price / MAexp100: | +0.39% |
News
The last news published on NZD/JPY at the time of the generation of this analysis was as follows:
-
 NZD/JPY Can Take Advantage of, But Not Dependent on Risk Appetite (Quick Takes Video)
-
Technica Focus: Big Confluence in NZD/JPY
-
Why selling the NZD/JPY could be ‘a good short-term trade’
About author

Online


Add a comment
Comments
0 comments on the analysis NZD/JPY - Daily