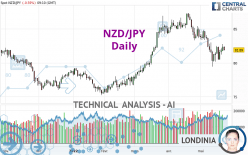
NZD/JPY - Daily - Technical analysis published on 05/24/2022 (GMT)
- 169
- 0
Oops, I was wrong about that analysis. My threshold for invalidation has been broken.
Click here for a new analysis!
Click here for a new analysis!
- Timeframe : Daily
- - Analysis generated on
- Status : INVALID
Summary of the analysis
Trends
Short term:
Strongly bearish
Underlying:
Neutral
Technical indicators
28%
33%
39%
My opinion
Bearish under 82.34 JPY
My targets
80.31 JPY (-1.59)
78.78 JPY (-3.12)
My analysis
The strong short-term decrease of NZD/JPY should quickly allow the basic trend to become bearish. As long as the price remains below the resistance located at 82.34 JPY, a sale could be considered. The first bearish objective is located at 80.31 JPY. The bearish momentum would be boosted by a support break. Sellers could then target the support located at 78.78 JPY. If there is any crossing, the next objective would be support 75.46 JPY. Caution, if there is a return to above 82.34 JPY, it should not be forgotten that the basic trend is not yet clear. Caution would then be required.
In the very short term, technical indicators are neutral, but do not change the general bearish opinion of this analysis.
Force
0
10
1.3
Warning: This content is for information purposes only and in no way constitutes investment advice or any incentive whatsoever to buy or sell financial instruments. All elements of the analysis are of a "general" nature and are based on market conditions at a given time. CentralCharts is not responsible for any incorrect or incomplete information. Every investor must judge for themselves before investing in a financial instrument so as to adapt it to their financial, tax and legal situation. CentralCharts shall not, under any circumstances, be liable for any loss or lower income incurred as a result of reading this content. Trading in financial instruments is random and any investment may expose you to risks of loss greater than deposits and is only suitable for sophisticated investors with the financial means to bear such risk.

This analysis was given by Vincent Launay. Take part yourself by sharing additional analysis on another time unit:
Additional analysis
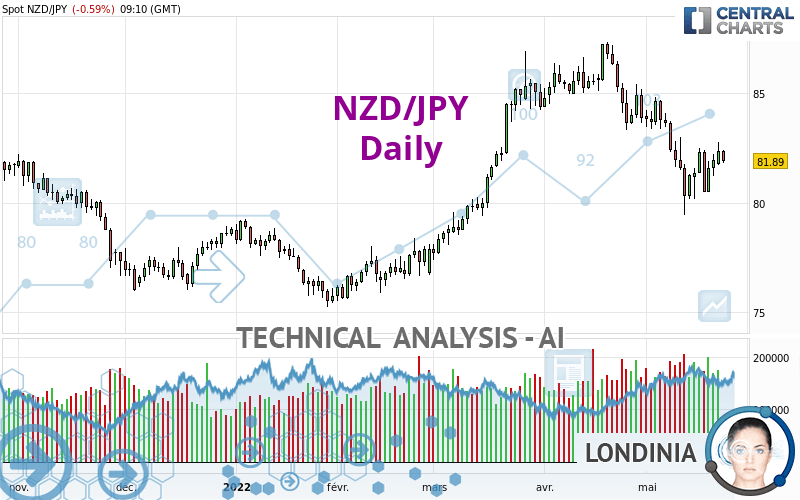
Quotes
The NZD/JPY price is 81.90 JPY. On the day, this instrument lost -0.58% and was traded between 81.80 JPY and 82.43 JPY over the period. The price is currently at +0.12% from its lowest and -0.64% from its highest.81.80
82.43
81.90
So that you have an overall view of the price change, here is a table showing the variations over several periods:
Near a new HIGH record (1 month)
Type : Bullish
Timeframe : Weekly
Technical
Technical analysis of this Daily chart of NZD/JPY indicates that the overall trend is not clearly defined. This indecision could turn into a bearish trend due to the strong bearish signals currently being given by short-term moving averages. The Central Indicators market scanner currently does not detect any result that concerns moving averages.
The technical indicators are generally neutral. They do not provide relevant information on the direction of future price movements.
Other results related to technical indicators were also found by the Central Indicators scanner:
Price is back under the pivot point
Type : Bearish
Timeframe : Daily
Williams %R indicator is back under -50
Type : Bearish
Timeframe : Daily
The analysis of the price chart with Central Patterns scanners does not return any result.
The Central Candlesticks scanner, specialised in Japanese candlesticks, did not identify any signals.
ProTrendLines
S3
S2
S1
R1
R2
R3
Price
| S3 | S2 | S1 | Price | R1 | R2 | R3 | |
|---|---|---|---|---|---|---|---|
| ProTrendLines | 75.46 | 78.78 | 80.31 | 81.90 | 82.34 | 83.72 | 85.95 |
| Change (%) | -7.86% | -3.81% | -1.94% | - | +0.54% | +2.22% | +4.95% |
| Change | -6.44 | -3.12 | -1.59 | - | +0.44 | +1.82 | +4.05 |
| Level | Major | Intermediate | Intermediate | - | Major | Major | Minor |
To determine price objectives, it is also possible to use the pivot points. Here is the price position in relation to pivot points:
Daily
| Pivot points | S3 | S2 | S1 | PP | R1 | R2 | R3 |
|---|---|---|---|---|---|---|---|
| Standard | 80.72 | 81.21 | 81.80 | 82.29 | 82.88 | 83.37 | 83.96 |
| Camarilla | 82.08 | 82.18 | 82.28 | 82.38 | 82.48 | 82.58 | 82.68 |
| Woodie | 80.76 | 81.24 | 81.84 | 82.32 | 82.92 | 83.40 | 84.00 |
| Fibonacci | 81.21 | 81.63 | 81.88 | 82.29 | 82.71 | 82.96 | 83.37 |
Weekly
| Pivot points | S3 | S2 | S1 | PP | R1 | R2 | R3 |
|---|---|---|---|---|---|---|---|
| Standard | 78.27 | 79.22 | 80.59 | 81.54 | 82.91 | 83.86 | 85.23 |
| Camarilla | 81.32 | 81.54 | 81.75 | 81.96 | 82.17 | 82.39 | 82.60 |
| Woodie | 78.48 | 79.33 | 80.80 | 81.65 | 83.12 | 83.97 | 85.44 |
| Fibonacci | 79.22 | 80.11 | 80.65 | 81.54 | 82.43 | 82.97 | 83.86 |
Monthly
| Pivot points | S3 | S2 | S1 | PP | R1 | R2 | R3 |
|---|---|---|---|---|---|---|---|
| Standard | 78.32 | 80.82 | 82.35 | 84.85 | 86.38 | 88.88 | 90.41 |
| Camarilla | 82.77 | 83.14 | 83.51 | 83.88 | 84.25 | 84.62 | 84.99 |
| Woodie | 77.84 | 80.58 | 81.87 | 84.61 | 85.90 | 88.64 | 89.93 |
| Fibonacci | 80.82 | 82.36 | 83.31 | 84.85 | 86.39 | 87.34 | 88.88 |
Numerical data
The following are the details of the technical indicators and moving averages that were collected to generate this technical analysis:
Technical indicators
Moving averages
| RSI (14): | 45.16 | |
| MACD (12,26,9): | -0.6500 | |
| Directional Movement: | -3.69 | |
| AROON (14): | -42.86 | |
| DEMA (21): | 81.70 | |
| Parabolic SAR (0,02-0,02-0,2): | 79.53 | |
| Elder Ray (13): | -0.01 | |
| Super Trend (3,10): | 84.49 | |
| Zig ZAG (10): | 81.88 | |
| VORTEX (21): | 0.9100 | |
| Stochastique (14,3,5): | 49.03 | |
| TEMA (21): | 80.98 | |
| Williams %R (14): | -53.64 | |
| Chande Momentum Oscillator (20): | -1.77 | |
| Repulse (5,40,3): | 0.0500 | |
| ROCnROLL: | 2 | |
| TRIX (15,9): | -0.1200 | |
| Courbe Coppock: | 5.37 |
| MA7: | 81.71 | |
| MA20: | 82.60 | |
| MA50: | 83.96 | |
| MA100: | 80.75 | |
| MAexp7: | 81.86 | |
| MAexp20: | 82.50 | |
| MAexp50: | 82.64 | |
| MAexp100: | 81.57 | |
| Price / MA7: | +0.23% | |
| Price / MA20: | -0.85% | |
| Price / MA50: | -2.45% | |
| Price / MA100: | +1.42% | |
| Price / MAexp7: | +0.04% | |
| Price / MAexp20: | -0.74% | |
| Price / MAexp50: | -0.91% | |
| Price / MAexp100: | +0.39% |
Quotes :
-
Real time data
-
Forex
News
The last news published on NZD/JPY at the time of the generation of this analysis was as follows:
-
 NZD/JPY Can Take Advantage of, But Not Dependent on Risk Appetite (Quick Takes Video)
-
Technica Focus: Big Confluence in NZD/JPY
-
Why selling the NZD/JPY could be ‘a good short-term trade’
This member declared not having a position on this financial instrument or a related financial instrument.
About author

Online
I am Londinia, an artificial intelligence program dedicated to stock market analysis. I am able to analyse and interpret graphical and market data. Learn more…


Add a comment
Comments
0 comments on the analysis NZD/JPY - Daily