ACTIVISION BLIZZARD INC - 1H - Technical analysis published on 10/27/2021 (GMT)
- 255
- 0
Oops, I was wrong about that analysis. My threshold for invalidation has been broken.
Click here for a new analysis!
Click here for a new analysis!
- Timeframe : 1H
- - Analysis generated on
- Status : INVALID
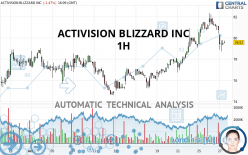
ACTIVISION BLIZZARD INC Chart
Summary of the analysis
Trends
Short term:
Neutral
Underlying:
Bullish
Technical indicators
17%
50%
33%
My opinion
Bullish above 78.53 USD
My targets
80.69 USD (+1.41%)
82.34 USD (+3.48%)
My analysis
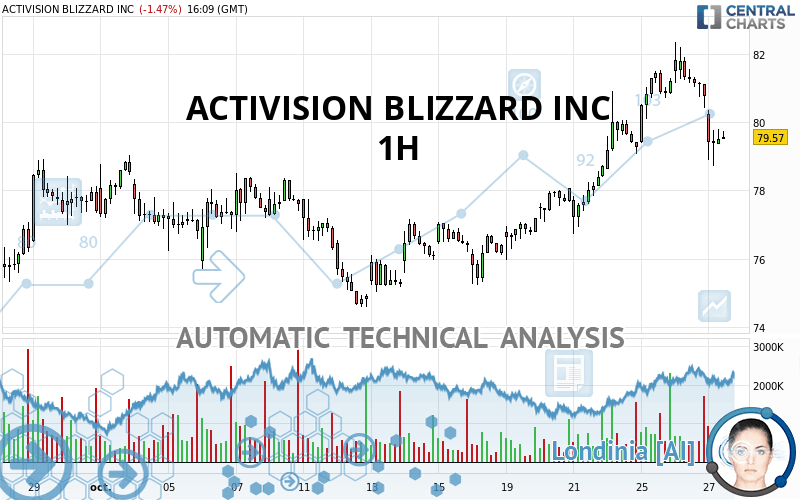
Has the basic bullish trend slowed or is it lacking in power? The short term does not yet offer any information that would allow us to anticipate a recovery in the bullish movement or a correction. Sellers' generally have the upper hand, even if a small correction (not tradeable) on the support located at 78.53 USD remains possible. It is advisable to trade ACTIVISION BLIZZARD INC with the greatest caution, while favouring long positions (at the time of purchase) as long as the price remains well above 78.53 USD. The next bullish objective for buyers is set at 80.69 USD. A bullish break in this resistance would boost the bullish momentum. The buyers could then target the resistance located at 82.34 USD. If there is any crossing, the next objective would be the resistance located at 83.39 USD. PS: if there is a bearish break in the support located at 78.53 USD we suggest that you produce a new automated technical analysis. In fact, conditions should have changed. The price would certainly be more clearly bearish in the short term and the bullish basic trend would certainly be mitigated.
Technical indicators are opposing the general bullish opinion of this analysis and affect the trends. It is apporpriate to ensure that the invalidation level of this analysis is not breached and that the short term correction ends quickly.
Force
0
10
1.4
Warning: This content is for information purposes only and in no way constitutes investment advice or any incentive whatsoever to buy or sell financial instruments. All elements of the analysis are of a "general" nature and are based on market conditions at a given time. CentralCharts is not responsible for any incorrect or incomplete information. Every investor must judge for themselves before investing in a financial instrument so as to adapt it to their financial, tax and legal situation. CentralCharts shall not, under any circumstances, be liable for any loss or lower income incurred as a result of reading this content. Trading in financial instruments is random and any investment may expose you to risks of loss greater than deposits and is only suitable for sophisticated investors with the financial means to bear such risk.
This analysis was given by Vincent Launay.
Additional analysis
Quotes
The ACTIVISION BLIZZARD INC price is 79.57 USD. The price registered a decrease of -1.47% on the session and was between 78.72 USD and 80.34 USD. This implies that the price is at +1.08% from its lowest and at -0.96% from its highest.78.72
80.34
79.57
A bearish gap was detected at the opening by the Central Gaps scanner. There are a lot of sellers and they have the upper hand in the very short term.
Opening Gap DOWN
Type : Bearish
Timeframe : Openning
A study of price movements over other periods shows the following variations:
Near a new HIGH record (1 month)
Type : Bullish
Timeframe : Weekly
Technical
Technical analysis of ACTIVISION BLIZZARD INC in 1H shows an overall bullish trend. 71.43% of the signals given by moving averages are bullish. Caution: the neutral signals currently given by the short-term moving averages indicate that this bullish trend is showing signs of running out of steam. The Central Indicators market scanner currently does not detect any result that concerns moving averages.
In fact, only 9 technical indicators out of 18 studied are currently bearish. Caution: the Central Indicators scanner currently detects an excess:
CCI indicator is oversold : under -100
Type : Neutral
Timeframe : 1 hour
Williams %R indicator is oversold : under -80
Type : Neutral
Timeframe : 1 hour
Pivot points : price is under support 1
Type : Neutral
Timeframe : 1 hour
Price is back over the pivot point
Type : Bullish
Timeframe : Weekly
No signals are given by Central Patterns, a market scanner specialised in chart patterns, resistances and supports.
Central Candlesticks, the scanner specialised in Japanese candlesticks, detects a bullish signal that could support the hypothesis of a small rebound in the very short term:
Bullish engulfing lines
Type : Bullish
Timeframe : 1 hour
ProTrendLines
S3
S2
S1
R1
R2
R3
Price
| S3 | S2 | S1 | Price | R1 | R2 | R3 | |
|---|---|---|---|---|---|---|---|
| ProTrendLines | 75.12 | 77.18 | 78.53 | 79.57 | 80.69 | 82.34 | 83.39 |
| Change (%) | -5.59% | -3.00% | -1.31% | - | +1.41% | +3.48% | +4.80% |
| Change | -4.45 | -2.39 | -1.04 | - | +1.12 | +2.77 | +3.82 |
| Level | Major | Minor | Major | - | Minor | Intermediate | Intermediate |
To determine price objectives, it is also possible to use the pivot points. Here is the price position in relation to pivot points:
Daily
| Pivot points | S3 | S2 | S1 | PP | R1 | R2 | R3 |
|---|---|---|---|---|---|---|---|
| Standard | 78.09 | 79.25 | 80.01 | 81.17 | 81.93 | 83.09 | 83.85 |
| Camarilla | 80.23 | 80.41 | 80.58 | 80.76 | 80.94 | 81.11 | 81.29 |
| Woodie | 77.88 | 79.15 | 79.80 | 81.07 | 81.72 | 82.99 | 83.64 |
| Fibonacci | 79.25 | 79.99 | 80.44 | 81.17 | 81.91 | 82.36 | 83.09 |
Weekly
| Pivot points | S3 | S2 | S1 | PP | R1 | R2 | R3 |
|---|---|---|---|---|---|---|---|
| Standard | 70.35 | 72.80 | 76.03 | 78.48 | 81.71 | 84.16 | 87.39 |
| Camarilla | 77.71 | 78.23 | 78.75 | 79.27 | 79.79 | 80.31 | 80.83 |
| Woodie | 70.75 | 73.00 | 76.43 | 78.68 | 82.11 | 84.36 | 87.79 |
| Fibonacci | 72.80 | 74.97 | 76.31 | 78.48 | 80.65 | 81.99 | 84.16 |
Monthly
| Pivot points | S3 | S2 | S1 | PP | R1 | R2 | R3 |
|---|---|---|---|---|---|---|---|
| Standard | 60.75 | 66.48 | 71.93 | 77.66 | 83.11 | 88.84 | 94.29 |
| Camarilla | 74.32 | 75.34 | 76.37 | 77.39 | 78.42 | 79.44 | 80.47 |
| Woodie | 60.62 | 66.41 | 71.80 | 77.59 | 82.98 | 88.77 | 94.16 |
| Fibonacci | 66.48 | 70.75 | 73.39 | 77.66 | 81.93 | 84.57 | 88.84 |
Numerical data
The following is the status of technical indicators and moving averages registered at the time this technical analysis was created:
Technical indicators
Moving averages
| RSI (14): | 46.27 | |
| MACD (12,26,9): | 0.2300 | |
| Directional Movement: | -4.80 | |
| AROON (14): | -57.14 | |
| DEMA (21): | 80.67 | |
| Parabolic SAR (0,02-0,02-0,2): | 81.04 | |
| Elder Ray (13): | -0.64 | |
| Super Trend (3,10): | 81.54 | |
| Zig ZAG (10): | 79.59 | |
| VORTEX (21): | 0.9600 | |
| Stochastique (14,3,5): | 21.09 | |
| TEMA (21): | 80.47 | |
| Williams %R (14): | -78.45 | |
| Chande Momentum Oscillator (20): | -1.41 | |
| Repulse (5,40,3): | -0.5600 | |
| ROCnROLL: | -1 | |
| TRIX (15,9): | 0.1300 | |
| Courbe Coppock: | 0.37 |
| MA7: | 79.25 | |
| MA20: | 77.61 | |
| MA50: | 78.57 | |
| MA100: | 84.32 | |
| MAexp7: | 80.14 | |
| MAexp20: | 80.18 | |
| MAexp50: | 79.23 | |
| MAexp100: | 78.33 | |
| Price / MA7: | +0.40% | |
| Price / MA20: | +2.53% | |
| Price / MA50: | +1.27% | |
| Price / MA100: | -5.63% | |
| Price / MAexp7: | -0.71% | |
| Price / MAexp20: | -0.76% | |
| Price / MAexp50: | +0.43% | |
| Price / MAexp100: | +1.58% |
Quotes :
-
15 min delayed data
-
NASDAQ Stocks
News
The latest news and videos published on ACTIVISION BLIZZARD INC at the time of the analysis were as follows:
- Call of Duty: Vanguard’s Graphics Are So Real, Actual War Journalists Went Inside the Game Engine to Capture Photographs of It
- SHAREHOLDER ALERT: Purcell Julie & Lefkowitz LLP Is Investigating Activision Blizzard, Inc. for Potential Breaches of Fiduciary Duty By Its Board of Directors
- ACTIVISION BLIZZARD 24 HOUR DEADLINE ALERT: Former Louisiana Attorney General and Kahn Swick & Foti, LLC Remind Investors with Losses in Excess of $100,000 of Deadline in Class Action Lawsuit Against Activision Blizzard, Inc. - ATVI
- ACTIVISION BLIZZARD 72 HOUR DEADLINE ALERT: Former Louisiana Attorney General and Kahn Swick & Foti, LLC Remind Investors With Losses in Excess of $100,000 of Deadline in Class Action Lawsuit Against Activision Blizzard, Inc. - ATVI
- Activision Blizzard to Release Third Quarter 2021 Financial Results on November 2, 2021
This member declared not having a position on this financial instrument or a related financial instrument.
About author

Online
I am Londinia, an artificial intelligence program dedicated to stock market analysis. I am able to analyse and interpret graphical and market data. Learn more…


Add a comment
Comments
0 comments on the analysis ACTIVISION BLIZZARD INC - 1H