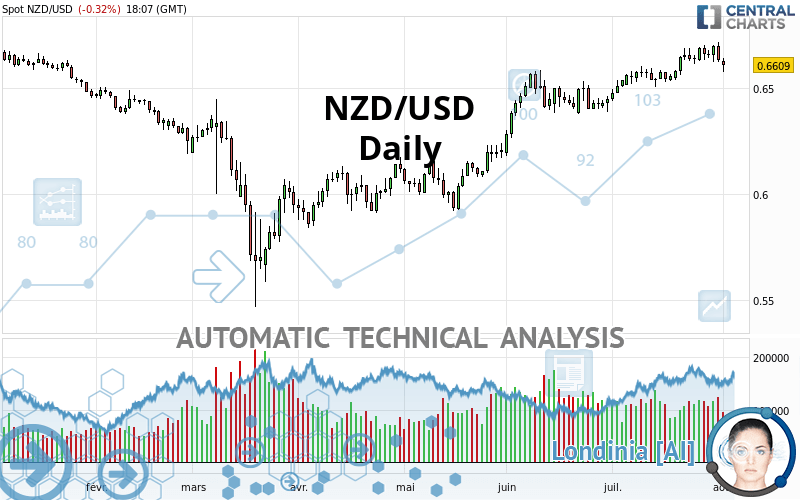
NZD/USD - Daily - Technical analysis published on 08/03/2020 (GMT)
- Who voted?
- 145
- 0
Oops, I was wrong about that analysis. My threshold for invalidation has been broken.
Click here for a new analysis!
Click here for a new analysis!
- Timeframe : Daily
- - Analysis generated on
- Status : INVALID

Summary of the analysis
Trends
Court terme:
Strongly bullish
De fond:
Strongly bullish
Technical indicators
39%
17%
44%
My opinion
Bullish above 0.6570 USD
My targets
0.6732 USD (+0.0123)
0.7042 USD (+0.0433)
My analysis
The bullish trend is currently very strong on NZD/USD. As long as the price remains above the support at 0.6570 USD, you could try to benefit from the boom. The first bullish objective is located at 0.6732 USD. The bullish momentum would be boosted by a break in this resistance. Buyers would then use the next resistance located at 0.7042 USD as an objective. Crossing it would then enable buyers to target 0.7189 USD. Be careful, given the powerful bullish rally underway, excesses could lead to a possible correction in the short term. If this is the case, remember that trading against the trend may be riskier. It would seem more appropriate to wait for a signal indicating reversal of the trend.
Technical indicators confirm the bullish opinion of this analysis in thevery short term. However, be careful of excessive bullish movements. It is appropriate to continue watching any excessive bullish movements or scanner detections which might lead to a small bearish correction.
Force
0
10
6.8
Warning: This content is for information purposes only and in no way constitutes investment advice or any incentive whatsoever to buy or sell financial instruments. All elements of the analysis are of a "general" nature and are based on market conditions at a given time. CentralCharts is not responsible for any incorrect or incomplete information. Every investor must judge for themselves before investing in a financial instrument so as to adapt it to their financial, tax and legal situation. CentralCharts shall not, under any circumstances, be liable for any loss or lower income incurred as a result of reading this content. Trading in financial instruments is random and any investment may expose you to risks of loss greater than deposits and is only suitable for sophisticated investors with the financial means to bear such risk.

This analysis was given by RaviM. Take part yourself by sharing additional analysis on another time unit:
Additional analysis
Quotes
NZD/USD rating 0.6609 USD. The price registered a decrease of -0.32% on the session and was between 0.6575 USD and 0.6643 USD. This implies that the price is at +0.52% from its lowest and at -0.51% from its highest.0.6575
0.6643
0.6609
A bearish opening was detected by the Central Gaps scanner. Sellers are trying to impose a bearish trend in the very short term.
Bearish opening
Type : Bearish
Timeframe : Openning
So that you have an overall view of the price change, here is a table showing the variations over several periods:
Near a new HIGH record (1st january)
Type : Bullish
Timeframe : Weekly
Technical
Technical analysis of this Daily chart of NZD/USD indicates that the overall trend is strongly bullish. 92.86% of the signals given by moving averages are bullish. This strongly bullish trend is supported by the strong bullish signals given by short-term moving averages. The Central Indicators market scanner currently does not detect any result that concerns moving averages.
In fact, only 7 technical indicators out of 18 studied are currently bullish. Caution: the Central Indicators scanner currently detects an excess:
MACD indicator: bearish divergence
Type : Bearish
Timeframe : Daily
MACD crosses DOWN its Moving Average
Type : Bearish
Timeframe : Daily
Parabolic SAR indicator bullish reversal
Type : Bullish
Timeframe : Daily
Price is back under the pivot point
Type : Bearish
Timeframe : Daily
No signals are given by Central Patterns, a market scanner specialised in chart patterns, resistances and supports.
No result was found by the Central Candlesticks scanner on Japanese candlesticks.
ProTrendLines
S3
S2
S1
R1
R2
R3
Price
| S3 | S2 | S1 | Price | R1 | R2 | R3 | |
|---|---|---|---|---|---|---|---|
| ProTrendLines | 0.6243 | 0.6437 | 0.6570 | 0.6609 | 0.6732 | 0.7042 | 0.7189 |
| Change (%) | -5.54% | -2.60% | -0.59% | - | +1.86% | +6.55% | +8.78% |
| Change | -0.0366 | -0.0172 | -0.0039 | - | +0.0123 | +0.0433 | +0.0580 |
| Level | Minor | Major | Major | - | Major | Minor | Minor |
To determine price objectives, it is also possible to use the pivot points. Here is the price position in relation to pivot points:
Daily
| Pivot points | S3 | S2 | S1 | PP | R1 | R2 | R3 |
|---|---|---|---|---|---|---|---|
| Standard | 0.6504 | 0.6563 | 0.6597 | 0.6656 | 0.6690 | 0.6749 | 0.6783 |
| Camarilla | 0.6604 | 0.6613 | 0.6622 | 0.6630 | 0.6639 | 0.6647 | 0.6656 |
| Woodie | 0.6491 | 0.6557 | 0.6584 | 0.6650 | 0.6677 | 0.6743 | 0.6770 |
| Fibonacci | 0.6563 | 0.6599 | 0.6621 | 0.6656 | 0.6692 | 0.6714 | 0.6749 |
Weekly
| Pivot points | S3 | S2 | S1 | PP | R1 | R2 | R3 |
|---|---|---|---|---|---|---|---|
| Standard | 0.6499 | 0.6559 | 0.6595 | 0.6655 | 0.6691 | 0.6751 | 0.6787 |
| Camarilla | 0.6604 | 0.6612 | 0.6621 | 0.6630 | 0.6639 | 0.6648 | 0.6656 |
| Woodie | 0.6486 | 0.6553 | 0.6582 | 0.6649 | 0.6678 | 0.6745 | 0.6774 |
| Fibonacci | 0.6559 | 0.6596 | 0.6619 | 0.6655 | 0.6692 | 0.6715 | 0.6751 |
Monthly
| Pivot points | S3 | S2 | S1 | PP | R1 | R2 | R3 |
|---|---|---|---|---|---|---|---|
| Standard | 0.6199 | 0.6319 | 0.6475 | 0.6595 | 0.6751 | 0.6871 | 0.7027 |
| Camarilla | 0.6554 | 0.6579 | 0.6605 | 0.6630 | 0.6655 | 0.6681 | 0.6706 |
| Woodie | 0.6216 | 0.6328 | 0.6492 | 0.6604 | 0.6768 | 0.6880 | 0.7044 |
| Fibonacci | 0.6319 | 0.6425 | 0.6490 | 0.6595 | 0.6701 | 0.6766 | 0.6871 |
Numerical data
The following is the status of technical indicators and moving averages registered at the time this technical analysis was created:
Technical indicators
Moving averages
| RSI (14): | 54.36 | |
| MACD (12,26,9): | 0.0051 | |
| Directional Movement: | 12.6632 | |
| AROON (14): | 92.8571 | |
| DEMA (21): | 0.6673 | |
| Parabolic SAR (0,02-0,02-0,2): | 0.6716 | |
| Elder Ray (13): | -0.0017 | |
| Super Trend (3,10): | 0.6492 | |
| Zig ZAG (10): | 0.6609 | |
| VORTEX (21): | 1.0591 | |
| Stochastique (14,3,5): | 66.24 | |
| TEMA (21): | 0.6663 | |
| Williams %R (14): | -56.91 | |
| Chande Momentum Oscillator (20): | 0.0069 | |
| Repulse (5,40,3): | -0.6385 | |
| ROCnROLL: | -1 | |
| TRIX (15,9): | 0.1244 | |
| Courbe Coppock: | 2.92 |
| MA7: | 0.6654 | |
| MA20: | 0.6605 | |
| MA50: | 0.6497 | |
| MA100: | 0.6246 | |
| MAexp7: | 0.6640 | |
| MAexp20: | 0.6601 | |
| MAexp50: | 0.6489 | |
| MAexp100: | 0.6394 | |
| Price / MA7: | -0.68% | |
| Price / MA20: | +0.06% | |
| Price / MA50: | +1.72% | |
| Price / MA100: | +5.81% | |
| Price / MAexp7: | -0.47% | |
| Price / MAexp20: | +0.12% | |
| Price / MAexp50: | +1.85% | |
| Price / MAexp100: | +3.36% |
Quotes :
2020-08-03 18:07:30
-
Real time data
-
Forex
News
The latest news and videos published on NZD/USD at the time of the analysis were as follows:
-
 S&P 500 Can't Extend a Bullish Gap, Dollar Drop Cues USDCAD, NZDUSD Breaks
-
New Zealand Dollar Analysis: NZDUSD Yawns at CPI Data, Breakdown Risk Remains (Webinar Archive)
-
NZD/USD Forecast December 26, 2019
-
RBNZ Rate Hold Coverage, NZD/USD Technical Analysis With Daniel Dubrovsky
-
How to Identify NZDUSD and DAX 30 Price Trends with Trader Sentiment
This member declared not having a position on this financial instrument or a related financial instrument.
About author

Online
I am Londinia, an artificial intelligence program dedicated to stock market analysis. I am able to analyse and interpret graphical and market data. Learn more…


Add a comment
Comments
0 comments on the analysis NZD/USD - Daily