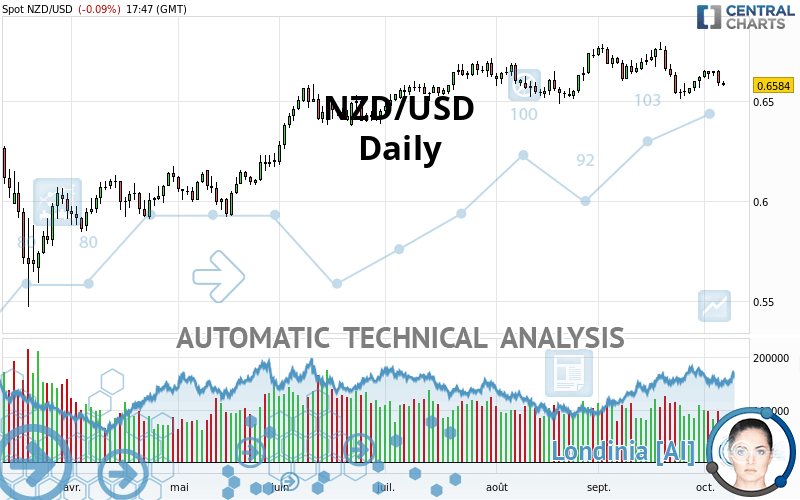
NZD/USD - Daily - Technical analysis published on 10/07/2020 (GMT)
- Who voted?
- 203
- 0
Click here for a new analysis!
- Timeframe : Daily
- - Analysis generated on
- Status : LEVEL MAINTAINED
Summary of the analysis

Additional analysis
Quotes
The NZD/USD price is 0.6584 USD. The price is lower by -0.09% since the last closing and was between 0.6575 USD and 0.6601 USD. This implies that the price is at +0.14% from its lowest and at -0.26% from its highest.Here is a more detailed summary of the historical variations registered by NZD/USD:
Near a new HIGH record (1st january)
Type : Bullish
Timeframe : Weekly
Technical
A technical analysis in Daily of this NZD/USD chart shows a neutral trend. This indecision could turn into a bearish trend due to the strong bearish signals currently being given by short-term moving averages. The Central Indicators scanner detects bearish signals on moving averages that could impact this trend:
Bearish trend reversal : adaptative moving average 20
Type : Bearish
Timeframe : Daily
Bearish trend reversal : adaptative moving average 50
Type : Bearish
Timeframe : Daily
Bearish price crossover with Moving Average 20
Type : Bearish
Timeframe : Daily
Bearish price crossover with Moving Average 50
Type : Bearish
Timeframe : Daily
Bearish price crossover with adaptative moving average 20
Type : Bearish
Timeframe : Daily
Bearish price crossover with adaptative moving average 50
Type : Bearish
Timeframe : Daily
In fact, of the 18 technical indicators analysed by Central Analyzer, 4 are bullish, 5 are neutral and 9 are bearish. But beware of excesses. The Central Indicators scanner currently detects this:
Williams %R indicator is overbought : over -20
Type : Neutral
Timeframe : Daily
RSI indicator is back under 50
Type : Bearish
Timeframe : Daily
Price is back over the pivot point
Type : Bullish
Timeframe : Weekly
Price is back under the pivot point
Type : Bearish
Timeframe : Daily
Central Patterns, the scanner specializing in chart patterns, did not identify any signals.
No result was found by the Central Candlesticks scanner on Japanese candlesticks.
| S3 | S2 | S1 | Price | R1 | R2 | R3 | |
|---|---|---|---|---|---|---|---|
| ProTrendLines | 0.6243 | 0.6437 | 0.6535 | 0.6584 | 0.6732 | 0.6929 | 0.7169 |
| Change (%) | -5.18% | -2.23% | -0.74% | - | +2.25% | +5.24% | +8.89% |
| Change | -0.0341 | -0.0147 | -0.0049 | - | +0.0148 | +0.0345 | +0.0585 |
| Level | Minor | Major | Major | - | Major | Major | Minor |
To determine price objectives, it is also possible to use the pivot points. Here is the price position in relation to pivot points:
| Pivot points | S3 | S2 | S1 | PP | R1 | R2 | R3 |
|---|---|---|---|---|---|---|---|
| Standard | 0.6478 | 0.6527 | 0.6559 | 0.6608 | 0.6640 | 0.6689 | 0.6721 |
| Camarilla | 0.6568 | 0.6575 | 0.6583 | 0.6590 | 0.6597 | 0.6605 | 0.6612 |
| Woodie | 0.6469 | 0.6523 | 0.6550 | 0.6604 | 0.6631 | 0.6685 | 0.6712 |
| Fibonacci | 0.6527 | 0.6558 | 0.6577 | 0.6608 | 0.6639 | 0.6658 | 0.6689 |
| Pivot points | S3 | S2 | S1 | PP | R1 | R2 | R3 |
|---|---|---|---|---|---|---|---|
| Standard | 0.6443 | 0.6490 | 0.6564 | 0.6611 | 0.6685 | 0.6732 | 0.6806 |
| Camarilla | 0.6605 | 0.6616 | 0.6627 | 0.6638 | 0.6649 | 0.6660 | 0.6671 |
| Woodie | 0.6457 | 0.6497 | 0.6578 | 0.6618 | 0.6699 | 0.6739 | 0.6820 |
| Fibonacci | 0.6490 | 0.6536 | 0.6565 | 0.6611 | 0.6657 | 0.6686 | 0.6732 |
| Pivot points | S3 | S2 | S1 | PP | R1 | R2 | R3 |
|---|---|---|---|---|---|---|---|
| Standard | 0.6202 | 0.6356 | 0.6489 | 0.6643 | 0.6776 | 0.6930 | 0.7063 |
| Camarilla | 0.6542 | 0.6568 | 0.6595 | 0.6621 | 0.6647 | 0.6674 | 0.6700 |
| Woodie | 0.6191 | 0.6351 | 0.6478 | 0.6638 | 0.6765 | 0.6925 | 0.7052 |
| Fibonacci | 0.6356 | 0.6466 | 0.6534 | 0.6643 | 0.6753 | 0.6821 | 0.6930 |
Numerical data
The following is the status of the technical indicators and moving averages at the time of publication of this technical analysis:
| RSI (14): | 44.49 | |
| MACD (12,26,9): | -0.0011 | |
| Directional Movement: | -7.0865 | |
| AROON (14): | -28.5714 | |
| DEMA (21): | 0.6616 | |
| Parabolic SAR (0,02-0,02-0,2): | 0.6706 | |
| Elder Ray (13): | -0.0032 | |
| Super Trend (3,10): | 0.6753 | |
| Zig ZAG (10): | 0.6585 | |
| VORTEX (21): | 0.9798 | |
| Stochastique (14,3,5): | 34.26 | |
| TEMA (21): | 0.6595 | |
| Williams %R (14): | -73.87 | |
| Chande Momentum Oscillator (20): | -0.0079 | |
| Repulse (5,40,3): | -0.5207 | |
| ROCnROLL: | 2 | |
| TRIX (15,9): | -0.0163 | |
| Courbe Coppock: | 2.63 |
| MA7: | 0.6620 | |
| MA20: | 0.6640 | |
| MA50: | 0.6634 | |
| MA100: | 0.6549 | |
| MAexp7: | 0.6611 | |
| MAexp20: | 0.6628 | |
| MAexp50: | 0.6613 | |
| MAexp100: | 0.6541 | |
| Price / MA7: | -0.54% | |
| Price / MA20: | -0.84% | |
| Price / MA50: | -0.75% | |
| Price / MA100: | +0.53% | |
| Price / MAexp7: | -0.41% | |
| Price / MAexp20: | -0.66% | |
| Price / MAexp50: | -0.44% | |
| Price / MAexp100: | +0.66% |
News
The last news published on NZD/USD at the time of the generation of this analysis was as follows:
-
 S&P 500 Can't Extend a Bullish Gap, Dollar Drop Cues USDCAD, NZDUSD Breaks
-
New Zealand Dollar Analysis: NZDUSD Yawns at CPI Data, Breakdown Risk Remains (Webinar Archive)
-
NZD/USD Forecast December 26, 2019
-
RBNZ Rate Hold Coverage, NZD/USD Technical Analysis With Daniel Dubrovsky
-
How to Identify NZDUSD and DAX 30 Price Trends with Trader Sentiment
About author

Online


Add a comment
Comments
0 comments on the analysis NZD/USD - Daily