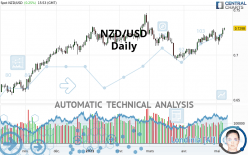
NZD/USD - Daily - Technical analysis published on 05/10/2021 (GMT)
- 184
- 0
Click here for a new analysis!
- Timeframe : Daily
- - Analysis generated on
- Status : INVALID

Summary of the analysis

Additional analysis
Quotes
The NZD/USD rating is 0.7298 USD. The price has increased by +0.25% since the last closing and was between 0.7271 USD and 0.7303 USD. This implies that the price is at +0.37% from its lowest and at -0.07% from its highest.A bullish opening was detected by the Central Gaps scanner. Buyers are trying to impose a bullish momentum in the very short term.
Bullish opening
Type : Bullish
Timeframe : Openning
Here is a more detailed summary of the historical variations registered by NZD/USD:
Near a new HIGH record (5 years)
Type : Bullish
Timeframe : Weekly
Near a new LOW record (1 month)
Type : Bearish
Timeframe : Weekly
Technical
A technical analysis in Daily of this NZD/USD chart shows a strongly bullish trend. 89.29% of the signals given by moving averages are bullish. This strongly bullish trend is supported by the strong bullish signals given by short-term moving averages. The Central Indicators scanner detects a bullish signal on moving averages that could impact this trend:
Bullish trend reversal : Moving Average 50
Type : Bullish
Timeframe : Daily
In fact, 15 technical indicators on 18 studied are currently bullish. Caution: the Central Indicators scanner currently detects an excess:
CCI indicator is overbought : over 100
Type : Neutral
Timeframe : Daily
Williams %R indicator is overbought : over -20
Type : Neutral
Timeframe : Daily
Parabolic SAR indicator bullish reversal
Type : Bullish
Timeframe : Daily
Aroon indicator bullish trend
Type : Bullish
Timeframe : Daily
Price is back over the pivot point
Type : Bullish
Timeframe : Daily
Price is back over the pivot point
Type : Bullish
Timeframe : Weekly
An analysis of the price chart with the Central Patterns scanner (detector of chart patterns and resistances and supports) shows several results that can have an impact on the price change:
Near horizontal resistance
Type : Bearish
Timeframe : Daily
Resistance of channel is broken
Type : Bullish
Timeframe : Daily
No result was found by the Central Candlesticks scanner on Japanese candlesticks.
| S3 | S2 | S1 | Price | R1 | R2 | R3 | |
|---|---|---|---|---|---|---|---|
| ProTrendLines | 0.6732 | 0.6929 | 0.7198 | 0.7298 | 0.7305 | 0.7395 | 0.7545 |
| Change (%) | -7.76% | -5.06% | -1.37% | - | +0.10% | +1.33% | +3.38% |
| Change | -0.0566 | -0.0369 | -0.0100 | - | +0.0007 | +0.0097 | +0.0247 |
| Level | Intermediate | Major | Major | - | Minor | Major | Intermediate |
To determine price objectives, it is also possible to use the pivot points. Here is the price position in relation to pivot points:
| Pivot points | S3 | S2 | S1 | PP | R1 | R2 | R3 |
|---|---|---|---|---|---|---|---|
| Standard | 0.7128 | 0.7167 | 0.7223 | 0.7262 | 0.7318 | 0.7357 | 0.7413 |
| Camarilla | 0.7254 | 0.7263 | 0.7271 | 0.7280 | 0.7289 | 0.7297 | 0.7306 |
| Woodie | 0.7138 | 0.7171 | 0.7233 | 0.7266 | 0.7328 | 0.7361 | 0.7423 |
| Fibonacci | 0.7167 | 0.7203 | 0.7225 | 0.7262 | 0.7298 | 0.7320 | 0.7357 |
| Pivot points | S3 | S2 | S1 | PP | R1 | R2 | R3 |
|---|---|---|---|---|---|---|---|
| Standard | 0.6978 | 0.7047 | 0.7163 | 0.7232 | 0.7348 | 0.7417 | 0.7533 |
| Camarilla | 0.7229 | 0.7246 | 0.7263 | 0.7280 | 0.7297 | 0.7314 | 0.7331 |
| Woodie | 0.7003 | 0.7059 | 0.7188 | 0.7244 | 0.7373 | 0.7429 | 0.7558 |
| Fibonacci | 0.7047 | 0.7117 | 0.7161 | 0.7232 | 0.7302 | 0.7346 | 0.7417 |
| Pivot points | S3 | S2 | S1 | PP | R1 | R2 | R3 |
|---|---|---|---|---|---|---|---|
| Standard | 0.6633 | 0.6789 | 0.6975 | 0.7131 | 0.7317 | 0.7473 | 0.7659 |
| Camarilla | 0.7067 | 0.7098 | 0.7130 | 0.7161 | 0.7192 | 0.7224 | 0.7255 |
| Woodie | 0.6648 | 0.6797 | 0.6990 | 0.7139 | 0.7332 | 0.7481 | 0.7674 |
| Fibonacci | 0.6789 | 0.6920 | 0.7000 | 0.7131 | 0.7262 | 0.7342 | 0.7473 |
Numerical data
The following are the details of the technical indicators and moving averages that were collected to generate this technical analysis:
| RSI (14): | 61.89 | |
| MACD (12,26,9): | 0.0038 | |
| Directional Movement: | 10.6115 | |
| AROON (14): | 28.5714 | |
| DEMA (21): | 0.7240 | |
| Parabolic SAR (0,02-0,02-0,2): | 0.7119 | |
| Elder Ray (13): | 0.0069 | |
| Super Trend (3,10): | 0.7090 | |
| Zig ZAG (10): | 0.7298 | |
| VORTEX (21): | 1.1931 | |
| Stochastique (14,3,5): | 84.85 | |
| TEMA (21): | 0.7273 | |
| Williams %R (14): | -2.66 | |
| Chande Momentum Oscillator (20): | 0.0143 | |
| Repulse (5,40,3): | 1.3574 | |
| ROCnROLL: | 1 | |
| TRIX (15,9): | 0.0612 | |
| Courbe Coppock: | 2.40 |
| MA7: | 0.7221 | |
| MA20: | 0.7196 | |
| MA50: | 0.7141 | |
| MA100: | 0.7173 | |
| MAexp7: | 0.7243 | |
| MAexp20: | 0.7196 | |
| MAexp50: | 0.7163 | |
| MAexp100: | 0.7112 | |
| Price / MA7: | +1.07% | |
| Price / MA20: | +1.42% | |
| Price / MA50: | +2.20% | |
| Price / MA100: | +1.74% | |
| Price / MAexp7: | +0.76% | |
| Price / MAexp20: | +1.42% | |
| Price / MAexp50: | +1.88% | |
| Price / MAexp100: | +2.62% |
News
The last news published on NZD/USD at the time of the generation of this analysis was as follows:
-
 NZD/USD Forecast April 5, 2021
-
S&P 500 Can't Extend a Bullish Gap, Dollar Drop Cues USDCAD, NZDUSD Breaks
-
New Zealand Dollar Analysis: NZDUSD Yawns at CPI Data, Breakdown Risk Remains (Webinar Archive)
-
NZD/USD Forecast December 26, 2019
-
RBNZ Rate Hold Coverage, NZD/USD Technical Analysis With Daniel Dubrovsky
About author

Online


Add a comment
Comments
0 comments on the analysis NZD/USD - Daily