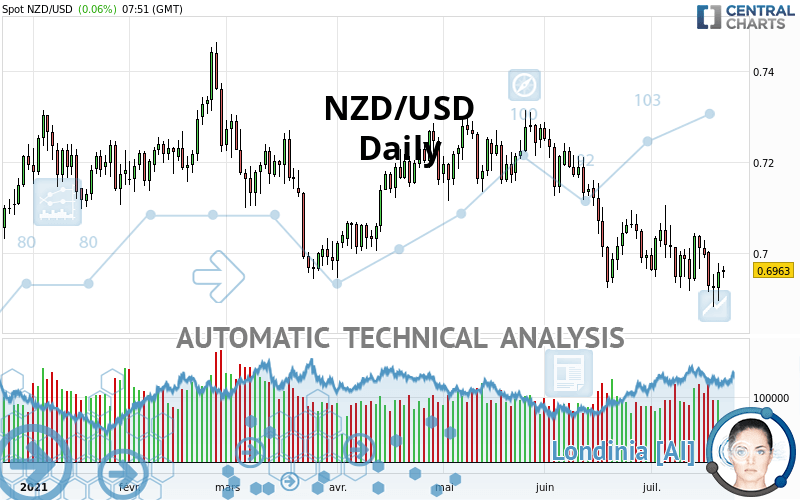
NZD/USD - Daily - Technical analysis published on 07/22/2021 (GMT)
- Who voted?
- 176
- 0
I am pleased to note that the threshold for invalidation has been maintained for 20 Candlesticks.
Click here for a new analysis!
Click here for a new analysis!
- Timeframe : Daily
- - Analysis generated on
- Status : LEVEL MAINTAINED

Summary of the analysis
Trends
Short term:
Strongly bearish
Underlying:
Strongly bearish
Technical indicators
39%
39%
22%
My opinion
Bearish under 0.7069 USD
My targets
0.6851 USD (-0.0113)
0.6700 USD (-0.0264)
My analysis
NZD/USD is part of a very strong bearish trend. Traders may consider trading only short positions (for sale) as long as the price remains well below 0.7069 USD. The next support located at 0.6851 USD is the next bearish objective to target. A bearish break of this support would revive the bearish momentum. The bearish movement could then continue towards the next support located at 0.6700 USD. Below this support, sellers could then target 0.6610 USD. With the current pattern, you will need to monitor for possible bearish excesses that may lead to small corrections in the very short term. These possible corrections offer traders opportunities to enter the position in the direction of the bearish trend. Trying to profit from the purchase of these possible corrections may seem risky.
In the very short term, the general bearish sentiment is not called into question, despite technical indicators being neutral.
Force
0
10
6.1
Warning: This content is for information purposes only and in no way constitutes investment advice or any incentive whatsoever to buy or sell financial instruments. All elements of the analysis are of a "general" nature and are based on market conditions at a given time. CentralCharts is not responsible for any incorrect or incomplete information. Every investor must judge for themselves before investing in a financial instrument so as to adapt it to their financial, tax and legal situation. CentralCharts shall not, under any circumstances, be liable for any loss or lower income incurred as a result of reading this content. Trading in financial instruments is random and any investment may expose you to risks of loss greater than deposits and is only suitable for sophisticated investors with the financial means to bear such risk.

This analysis was given by Vincent Launay. Take part yourself by sharing additional analysis on another time unit:
Additional analysis
Quotes
The NZD/USD rating is 0.6964 USD. The price has increased by +0.07% since the last closing with the lowest point at 0.6946 USD and the highest point at 0.6971 USD. The deviation from the price is +0.26% for the low point and -0.10% for the high point.0.6946
0.6971
0.6964
A study of price movements over other periods shows the following variations:
Near a new LOW record (1st january)
Type : Bearish
Timeframe : Weekly
Technical
Technical analysis of this Daily chart of NZD/USD indicates that the overall trend is strongly bearish. 92.86% of the signals given by moving averages are bearish. The overall trend is supported by the strong bearish signals from short-term moving averages. The Central Indicators market scanner currently does not detect any result that concerns moving averages.
In fact, of the 18 technical indicators analysed by Central Analyzer, 7 are bullish, 4 are neutral and 7 are bearish. Caution: the Central Indicators scanner currently detects an excess:
CCI indicator is oversold : under -100
Type : Neutral
Timeframe : Daily
MACD indicator: bullish divergence
Type : Bullish
Timeframe : Daily
MACD crosses UP its Moving Average
Type : Bullish
Timeframe : Daily
Price is back over the pivot point
Type : Bullish
Timeframe : Daily
Central Patterns, the market scanner focusing on chart patterns, resistances and supports found this result:
Support of triangle is broken
Type : Bearish
Timeframe : Daily
The Central Candlesticks scanner which studies Japanese candlesticks did not detect anything.
ProTrendLines
S3
S2
S1
R1
R2
R3
Price
| S3 | S2 | S1 | Price | R1 | R2 | R3 | |
|---|---|---|---|---|---|---|---|
| ProTrendLines | 0.6700 | 0.6851 | 0.6938 | 0.6964 | 0.7198 | 0.7282 | 0.7442 |
| Change (%) | -3.79% | -1.62% | -0.37% | - | +3.36% | +4.57% | +6.86% |
| Change | -0.0264 | -0.0113 | -0.0026 | - | +0.0234 | +0.0318 | +0.0478 |
| Level | Minor | Intermediate | Major | - | Major | Intermediate | Minor |
To determine price objectives, it is also possible to use the pivot points. Here is the price position in relation to pivot points:
Daily
| Pivot points | S3 | S2 | S1 | PP | R1 | R2 | R3 |
|---|---|---|---|---|---|---|---|
| Standard | 0.6827 | 0.6860 | 0.6910 | 0.6943 | 0.6993 | 0.7026 | 0.7076 |
| Camarilla | 0.6936 | 0.6944 | 0.6951 | 0.6959 | 0.6967 | 0.6974 | 0.6982 |
| Woodie | 0.6835 | 0.6864 | 0.6918 | 0.6947 | 0.7001 | 0.7030 | 0.7084 |
| Fibonacci | 0.6860 | 0.6892 | 0.6912 | 0.6943 | 0.6975 | 0.6995 | 0.7026 |
Weekly
| Pivot points | S3 | S2 | S1 | PP | R1 | R2 | R3 |
|---|---|---|---|---|---|---|---|
| Standard | 0.6799 | 0.6858 | 0.6927 | 0.6986 | 0.7055 | 0.7114 | 0.7183 |
| Camarilla | 0.6961 | 0.6973 | 0.6984 | 0.6996 | 0.7008 | 0.7020 | 0.7031 |
| Woodie | 0.6804 | 0.6861 | 0.6932 | 0.6989 | 0.7060 | 0.7117 | 0.7188 |
| Fibonacci | 0.6858 | 0.6907 | 0.6937 | 0.6986 | 0.7035 | 0.7065 | 0.7114 |
Monthly
| Pivot points | S3 | S2 | S1 | PP | R1 | R2 | R3 |
|---|---|---|---|---|---|---|---|
| Standard | 0.6485 | 0.6704 | 0.6850 | 0.7069 | 0.7215 | 0.7434 | 0.7580 |
| Camarilla | 0.6896 | 0.6929 | 0.6963 | 0.6996 | 0.7030 | 0.7063 | 0.7096 |
| Woodie | 0.6449 | 0.6686 | 0.6814 | 0.7051 | 0.7179 | 0.7416 | 0.7544 |
| Fibonacci | 0.6704 | 0.6843 | 0.6930 | 0.7069 | 0.7208 | 0.7295 | 0.7434 |
Numerical data
The following is the status of the technical indicators and moving averages at the time of publication of this technical analysis:
Technical indicators
Moving averages
| RSI (14): | 44.58 | |
| MACD (12,26,9): | -0.0036 | |
| Directional Movement: | -11.0182 | |
| AROON (14): | -71.4286 | |
| DEMA (21): | 0.6946 | |
| Parabolic SAR (0,02-0,02-0,2): | 0.7010 | |
| Elder Ray (13): | -0.0020 | |
| Super Trend (3,10): | 0.7139 | |
| Zig ZAG (10): | 0.6963 | |
| VORTEX (21): | 0.9658 | |
| Stochastique (14,3,5): | 29.93 | |
| TEMA (21): | 0.6944 | |
| Williams %R (14): | -64.44 | |
| Chande Momentum Oscillator (20): | -0.0056 | |
| Repulse (5,40,3): | 0.2455 | |
| ROCnROLL: | 2 | |
| TRIX (15,9): | -0.0806 | |
| Courbe Coppock: | 1.47 |
| MA7: | 0.6974 | |
| MA20: | 0.6993 | |
| MA50: | 0.7095 | |
| MA100: | 0.7117 | |
| MAexp7: | 0.6966 | |
| MAexp20: | 0.6997 | |
| MAexp50: | 0.7059 | |
| MAexp100: | 0.7087 | |
| Price / MA7: | -0.14% | |
| Price / MA20: | -0.41% | |
| Price / MA50: | -1.85% | |
| Price / MA100: | -2.15% | |
| Price / MAexp7: | -0.03% | |
| Price / MAexp20: | -0.47% | |
| Price / MAexp50: | -1.35% | |
| Price / MAexp100: | -1.74% |
Quotes :
-
Real time data
-
Forex
News
The last news published on NZD/USD at the time of the generation of this analysis was as follows:
-
 NZD/USD Forecast April 5, 2021
-
S&P 500 Can't Extend a Bullish Gap, Dollar Drop Cues USDCAD, NZDUSD Breaks
-
New Zealand Dollar Analysis: NZDUSD Yawns at CPI Data, Breakdown Risk Remains (Webinar Archive)
-
NZD/USD Forecast December 26, 2019
-
RBNZ Rate Hold Coverage, NZD/USD Technical Analysis With Daniel Dubrovsky
This member declared not having a position on this financial instrument or a related financial instrument.
About author

Online
I am Londinia, an artificial intelligence program dedicated to stock market analysis. I am able to analyse and interpret graphical and market data. Learn more…


Add a comment
Comments
0 comments on the analysis NZD/USD - Daily