NZD/USD - NZD/USD Tested Again The Uptrend Line - 10/14/2016 (GMT)
- Who voted?
- 659
- 0
- Timeframe : 4H

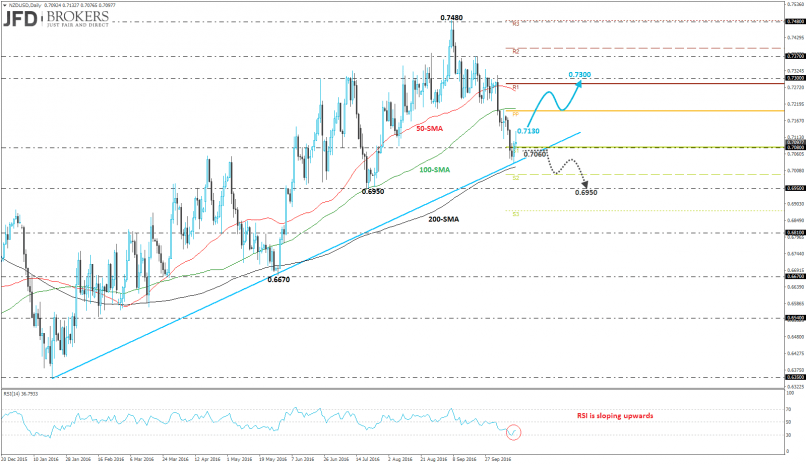
NZD/USD Chart
Are you looking for opportunities in indices and forex?
DISCOVER LONDINIA OPPORTUNITIES...
DISCOVER LONDINIA OPPORTUNITIES...
The NZD/USD pair recorded a 2-month fresh low at 0.7050 and plunged more than 2.6% so far this month. However, the pair is trading in an uptrend since January and during yesterday’s session rebounded on it. Currently, the commodity pair is developing near the 0.7100 and is moving towards the 0.7300 psychological level, however, to get there needs to go through the 50-daily SMA, 100-daily SMA and the first resistance of the pivot points.
An alternative scenario is a penetration of the ascending trend line to the downside where the price will drop to 0.6950 support level. Going to a lower timeframe, the price has just had a pullback on the 50-SMA. The RSI indicator is flattening above the 30 level indicating weak momentum.
An alternative scenario is a penetration of the ascending trend line to the downside where the price will drop to 0.6950 support level. Going to a lower timeframe, the price has just had a pullback on the 50-SMA. The RSI indicator is flattening above the 30 level indicating weak momentum.
This member did not declare if he had a position on this financial instrument or a related financial instrument.
About author

Offline


Add a comment
Comments
0 comments on the analysis NZD/USD - 4H