NZD/USD - Posted a Sharp Green Day and Is Approaching the 0.7055 Critical Level - 11/09/2017 (GMT)
- Who voted?
- 310
- 0
- Timeframe : Daily
NZD/USD Chart
Are you looking for opportunities in indices and forex?
DISCOVER LONDINIA OPPORTUNITIES...
DISCOVER LONDINIA OPPORTUNITIES...
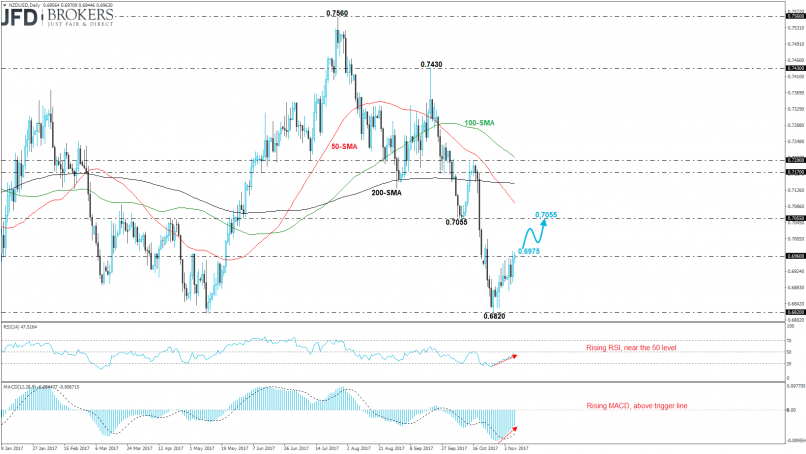
The New Zealand dollar had an aggressive bullish run against the U.S. dollar and added 0.8% to its performance after the release of the RBNZ interest rate decision. Currently, the commodity currency pair exposed above the 0.6960 barrier and is developing towards the 0.7055 resistance level, which overlaps with the 100-week SMA. In addition, the price is completing the second green week in a row as is trying to cover some of the previous month’s losses.
Technical indicators on the daily chart are biased higher in the negative territory. The MACD oscillator is moving above its trigger lines suggesting a stronger price in the next few sessions. Furthermore, the Relative Strength Index (RSI) is rising in a downward path below 50 but is confirming the recent bullish attitude of the price.
Technical indicators on the daily chart are biased higher in the negative territory. The MACD oscillator is moving above its trigger lines suggesting a stronger price in the next few sessions. Furthermore, the Relative Strength Index (RSI) is rising in a downward path below 50 but is confirming the recent bullish attitude of the price.
This member declared not having a position on this financial instrument or a related financial instrument.
About author

Offline


Add a comment
Comments
0 comments on the analysis NZD/USD - Daily