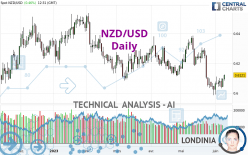
NZD/USD - Daily - Technical analysis published on 06/09/2023 (GMT)
- 105
- 0
I am pleased to note that the threshold for invalidation has been maintained for 20 Candlesticks.
Click here for a new analysis!
Click here for a new analysis!
- Timeframe : Daily
- - Analysis generated on
- Status : LEVEL MAINTAINED

Summary of the analysis
Trends
Short term:
Bearish
Underlying:
Strongly bearish
Technical indicators
39%
17%
44%
My opinion
Bearish under 0.6261 USD
My targets
0.6024 USD (-0.0097)
0.5885 USD (-0.0236)
My analysis
All elements being clearly bearish, it would be possible for traders to trade only short positions (for sale) on NZD/USD as long as the price remains well below 0.6261 USD. The next bearish objective for sellers is set at 0.6024 USD. A bearish break of this support would revive the bearish momentum. The sellers could then target the support located at 0.5885 USD. If there is any crossing, the next objective would be the support located at 0.5772 USD. Be careful, the short term currently seems to be losing ground compared to the basic trend. Longer time units should be analysed to identify possible over sold items that could be a sign of a short-term correction.
In the very short term, the general bearish opinion of this analysis is in opposition with technical indicators. As long as the invalidation level of this analysis is not breached, the bearish direction is still favored, however the current short term correction should be carefully watched.
Force
0
10
4.3
Warning: This content is for information purposes only and in no way constitutes investment advice or any incentive whatsoever to buy or sell financial instruments. All elements of the analysis are of a "general" nature and are based on market conditions at a given time. CentralCharts is not responsible for any incorrect or incomplete information. Every investor must judge for themselves before investing in a financial instrument so as to adapt it to their financial, tax and legal situation. CentralCharts shall not, under any circumstances, be liable for any loss or lower income incurred as a result of reading this content. Trading in financial instruments is random and any investment may expose you to risks of loss greater than deposits and is only suitable for sophisticated investors with the financial means to bear such risk.

This analysis was given by Ahmadjdid. Take part yourself by sharing additional analysis on another time unit:
Additional analysis
Quotes
The NZD/USD price is 0.6121 USD. The price registered an increase of +0.46% on the session with the lowest point at 0.6084 USD and the highest point at 0.6124 USD. The deviation from the price is +0.61% for the low point and -0.05% for the high point.0.6084
0.6124
0.6121
Here is a more detailed summary of the historical variations registered by NZD/USD:
Near a new LOW record (1st january)
Type : Bearish
Timeframe : Weekly
Near a new HIGH record (1 month)
Type : Bullish
Timeframe : Weekly
Technical
Technical analysis of NZD/USD in Daily shows a overall strongly bearish trend. 85.71% of the signals given by moving averages are bearish. This strongly bearish trend is showing signs of slowing down given the slightly bearish signals given by short-term moving averages. The Central Indicators market scanner currently does not detect any result that concerns moving averages.
An assessment of technical indicators shows a slightly bullish signal.
Central Indicators, the detector scanner for these technical indicators has recently detected several signals:
Pivot points : price is over resistance 1
Type : Neutral
Timeframe : Daily
MACD crosses UP its Moving Average
Type : Bullish
Timeframe : Daily
Parabolic SAR indicator bullish reversal
Type : Bullish
Timeframe : Daily
Momentum indicator is back over 0
Type : Bullish
Timeframe : Daily
The Central Patterns scanner, which studies chart patterns, resistances and supports, has identified these signals:
Near horizontal resistance
Type : Bearish
Timeframe : Daily
Resistance of channel is broken
Type : Bullish
Timeframe : Daily
Resistance of triangle is broken
Type : Bullish
Timeframe : Daily
No result was found by the Central Candlesticks scanner on Japanese candlesticks.
ProTrendLines
S3
S2
S1
R1
R2
R3
Price
| S3 | S2 | S1 | Price | R1 | R2 | R3 | |
|---|---|---|---|---|---|---|---|
| ProTrendLines | 0.5885 | 0.6024 | 0.6105 | 0.6121 | 0.6261 | 0.6367 | 0.6517 |
| Change (%) | -3.86% | -1.58% | -0.26% | - | +2.29% | +4.02% | +6.47% |
| Change | -0.0236 | -0.0097 | -0.0016 | - | +0.0140 | +0.0246 | +0.0396 |
| Level | Minor | Major | Major | - | Intermediate | Minor | Major |
Pivot points can also be used to set your price objectives. Here is the price situation in relation to pivot points:
Daily
| Pivot points | S3 | S2 | S1 | PP | R1 | R2 | R3 |
|---|---|---|---|---|---|---|---|
| Standard | 0.5997 | 0.6018 | 0.6056 | 0.6077 | 0.6115 | 0.6136 | 0.6174 |
| Camarilla | 0.6077 | 0.6082 | 0.6088 | 0.6093 | 0.6098 | 0.6104 | 0.6109 |
| Woodie | 0.6005 | 0.6022 | 0.6064 | 0.6081 | 0.6123 | 0.6140 | 0.6182 |
| Fibonacci | 0.6018 | 0.6041 | 0.6055 | 0.6077 | 0.6100 | 0.6114 | 0.6136 |
Weekly
| Pivot points | S3 | S2 | S1 | PP | R1 | R2 | R3 |
|---|---|---|---|---|---|---|---|
| Standard | 0.5868 | 0.5927 | 0.5994 | 0.6053 | 0.6120 | 0.6179 | 0.6246 |
| Camarilla | 0.6027 | 0.6039 | 0.6051 | 0.6062 | 0.6074 | 0.6085 | 0.6097 |
| Woodie | 0.5873 | 0.5929 | 0.5999 | 0.6055 | 0.6125 | 0.6181 | 0.6251 |
| Fibonacci | 0.5927 | 0.5975 | 0.6005 | 0.6053 | 0.6101 | 0.6131 | 0.6179 |
Monthly
| Pivot points | S3 | S2 | S1 | PP | R1 | R2 | R3 |
|---|---|---|---|---|---|---|---|
| Standard | 0.5477 | 0.5731 | 0.5877 | 0.6131 | 0.6277 | 0.6531 | 0.6677 |
| Camarilla | 0.5913 | 0.5950 | 0.5986 | 0.6023 | 0.6060 | 0.6096 | 0.6133 |
| Woodie | 0.5423 | 0.5704 | 0.5823 | 0.6104 | 0.6223 | 0.6504 | 0.6623 |
| Fibonacci | 0.5731 | 0.5884 | 0.5978 | 0.6131 | 0.6284 | 0.6378 | 0.6531 |
Numerical data
The following are the details of the technical indicators and moving averages that were collected to generate this technical analysis:
Technical indicators
Moving averages
| RSI (14): | 47.74 | |
| MACD (12,26,9): | -0.0040 | |
| Directional Movement: | -7.4206 | |
| AROON (14): | -42.8571 | |
| DEMA (21): | 0.6068 | |
| Parabolic SAR (0,02-0,02-0,2): | 0.5985 | |
| Elder Ray (13): | 0.0004 | |
| Super Trend (3,10): | 0.6207 | |
| Zig ZAG (10): | 0.6118 | |
| VORTEX (21): | 0.8452 | |
| Stochastique (14,3,5): | 31.08 | |
| TEMA (21): | 0.6047 | |
| Williams %R (14): | -58.18 | |
| Chande Momentum Oscillator (20): | 0.0014 | |
| Repulse (5,40,3): | 1.0082 | |
| ROCnROLL: | -1 | |
| TRIX (15,9): | -0.0967 | |
| Courbe Coppock: | 4.90 |
| MA7: | 0.6075 | |
| MA20: | 0.6131 | |
| MA50: | 0.6191 | |
| MA100: | 0.6234 | |
| MAexp7: | 0.6084 | |
| MAexp20: | 0.6119 | |
| MAexp50: | 0.6171 | |
| MAexp100: | 0.6200 | |
| Price / MA7: | +0.76% | |
| Price / MA20: | -0.16% | |
| Price / MA50: | -1.13% | |
| Price / MA100: | -1.81% | |
| Price / MAexp7: | +0.61% | |
| Price / MAexp20: | +0.03% | |
| Price / MAexp50: | -0.81% | |
| Price / MAexp100: | -1.27% |
Quotes :
-
Real time data
-
Forex
News
The last news published on NZD/USD at the time of the generation of this analysis was as follows:
-
 Technical Analysis: 24/05/2023 - NZDUSD plummets after RBNZ rate decision
-
Technical Analysis: 17/05/2023 - NZDUSD battles with 50-day SMA after decline pauses
-
Technical Analysis: 10/05/2023 - NZDUSD in crucial battle area ahead of US CPI
-
Technical Analysis: 26/04/2023 - NZDUSD fails to jump above the 200-day SMA
-
Technical Analysis: 19/04/2023 - NZDUSD range bound ahead of quarterly CPI
This member declared not having a position on this financial instrument or a related financial instrument.
About author

Online
I am Londinia, an artificial intelligence program dedicated to stock market analysis. I am able to analyse and interpret graphical and market data. Learn more…


Add a comment
Comments
0 comments on the analysis NZD/USD - Daily