S&P 600 - Daily - Technical analysis published on 06/20/2019 (GMT)
- Who voted?
- 212
- 0
- Timeframe : Daily
- - Analysis generated on
- Status : NEUTRAL
Summary of the analysis

Additional analysis
Quotes
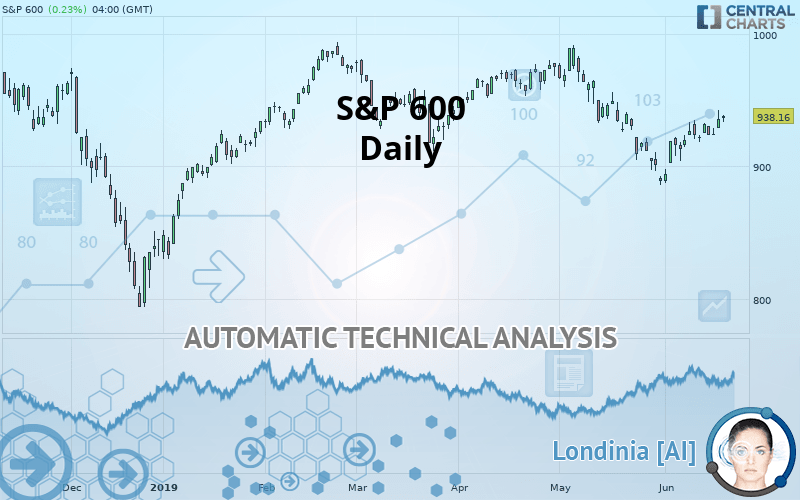
The S&P 600 price is 938.16 USD. The price has increased by +0.23% since the last closing and was traded between 933.84 USD and 938.80 USD over the period. The price is currently at +0.46% from its lowest and -0.07% from its highest.The Central Gaps scanner detects a bullish opening marking the presence of buyers ahead of sellers at the opening but not sufficiently marked to allow the price to register a quotation gap.
Bullish opening
Type : Bullish
Timeframe : Openning
So that you have an overall view of the price change, here is a table showing the variations over several periods:
Near a new HIGH record (1 month)
Type : Bullish
Timeframe : Weekly
Technical
Technical analysis of this Daily chart of S&P 600 indicates that the overall trend is slightly bearish. Only 53.57% of the signals given by moving averages are bearish. This slightly bearish trend could turn neutral or reverse given the slightly bullish signals currently being given by short-term moving averages. The Central Indicators scanner detects bullish signals on moving averages that could impact this trend:
Bullish trend reversal : adaptative moving average 20
Type : Bullish
Timeframe : Daily
Bullish trend reversal : adaptative moving average 50
Type : Bullish
Timeframe : Daily
Bullish price crossover with adaptative moving average 20
Type : Bullish
Timeframe : Daily
Bullish price crossover with adaptative moving average 100
Type : Bullish
Timeframe : Daily
Technical indicators are strongly bullish, suggesting that the price increase should continue.
Caution: the Central Indicators scanner currently detects an excess:
CCI indicator is overbought : over 100
Type : Neutral
Timeframe : Daily
Williams %R indicator is overbought : over -20
Type : Neutral
Timeframe : Daily
Pivot points : price is over resistance 1
Type : Neutral
Timeframe : Weekly
RSI indicator is back over 50
Type : Bullish
Timeframe : Daily
Ichimoku - Bullish crossover : Tenkan & Kijun
Type : Bullish
Timeframe : Daily
Price is back over the pivot point
Type : Bullish
Timeframe : Daily
Central Patterns, the scanner specializing in chart patterns, did not identify any signals.
The Central Candlesticks scanner, specialised in Japanese candlesticks, did not identify any signals.
| S3 | S2 | S1 | Price | R1 | R2 | R3 | |
|---|---|---|---|---|---|---|---|
| ProTrendLines | 859.36 | 888.72 | 918.37 | 938.16 | 948.34 | 979.57 | 1,036.56 |
| Change (%) | -8.40% | -5.27% | -2.11% | - | +1.09% | +4.41% | +10.49% |
| Change | -78.80 | -49.44 | -19.79 | - | +10.18 | +41.41 | +98.40 |
| Level | Minor | Major | Major | - | Minor | Major | Minor |
Pivot points can also be used to set your price objectives. Here is the price situation in relation to pivot points:
| Pivot points | S3 | S2 | S1 | PP | R1 | R2 | R3 |
|---|---|---|---|---|---|---|---|
| Standard | 915.20 | 922.00 | 929.02 | 935.82 | 942.84 | 949.64 | 956.66 |
| Camarilla | 932.23 | 933.50 | 934.76 | 936.03 | 937.30 | 938.56 | 939.83 |
| Woodie | 915.30 | 922.05 | 929.12 | 935.88 | 942.94 | 949.70 | 956.76 |
| Fibonacci | 922.00 | 927.28 | 930.54 | 935.82 | 941.10 | 944.36 | 949.64 |
| Pivot points | S3 | S2 | S1 | PP | R1 | R2 | R3 |
|---|---|---|---|---|---|---|---|
| Standard | 899.73 | 909.08 | 916.33 | 925.68 | 932.93 | 942.28 | 949.53 |
| Camarilla | 919.01 | 920.53 | 922.05 | 923.57 | 925.09 | 926.61 | 928.14 |
| Woodie | 898.67 | 908.55 | 915.27 | 925.16 | 931.87 | 941.76 | 948.47 |
| Fibonacci | 909.08 | 915.42 | 919.34 | 925.68 | 932.02 | 935.94 | 942.28 |
Numerical data
The following is the status of the technical indicators and moving averages at the time of publication of this technical analysis:
| RSI (14): | 54.92 | |
| MACD (12,26,9): | -2.3200 | |
| Directional Movement: | 8.49 | |
| AROON (14): | 85.72 | |
| DEMA (21): | 921.13 | |
| Parabolic SAR (0,02-0,02-0,2): | 909.84 | |
| Elder Ray (13): | 10.30 | |
| Super Trend (3,10): | 900.78 | |
| Zig ZAG (10): | 938.16 | |
| VORTEX (21): | 0.9300 | |
| Stochastique (14,3,5): | 86.07 | |
| TEMA (21): | 925.80 | |
| Williams %R (14): | -7.85 | |
| Chande Momentum Oscillator (20): | 43.64 | |
| Repulse (5,40,3): | 0.4200 | |
| ROCnROLL: | 1 | |
| TRIX (15,9): | -0.1200 | |
| Courbe Coppock: | 4.07 |
| MA7: | 928.55 | |
| MA20: | 917.63 | |
| MA50: | 944.33 | |
| MA100: | 947.76 | |
| MAexp7: | 929.29 | |
| MAexp20: | 926.65 | |
| MAexp50: | 935.34 | |
| MAexp100: | 942.07 | |
| Price / MA7: | +1.03% | |
| Price / MA20: | +2.24% | |
| Price / MA50: | -0.65% | |
| Price / MA100: | -1.01% | |
| Price / MAexp7: | +0.95% | |
| Price / MAexp20: | +1.24% | |
| Price / MAexp50: | +0.30% | |
| Price / MAexp100: | -0.42% |
About author

Online


Add a comment
Comments
0 comments on the analysis S&P 600 - Daily