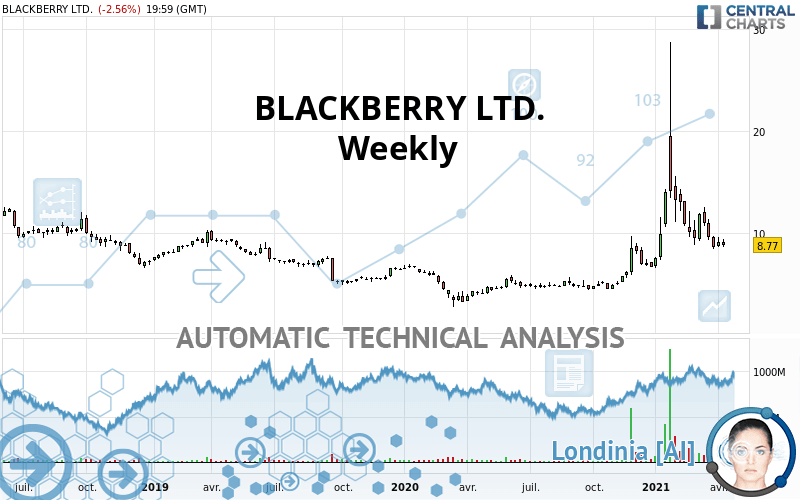
BLACKBERRY LTD. - Weekly - Technical analysis published on 04/16/2021 (GMT)
- 266
- 0
I am delighted to see that my first price objective has been achieved. I hope you've taken advantage of it.
Click here for a new analysis!
Click here for a new analysis!
- Timeframe : Weekly
- - Analysis generated on
- Status : TARGET REACHED
Summary of the analysis
Trends
Short term:
Neutral
Underlying:
Bullish
Technical indicators
17%
33%
50%
My opinion
Bullish above 7.02 USD
My targets
9.77 USD (+11.40%)
10.14 USD (+15.62%)
My analysis
We are currently in a phase of short-term indecision. In a case like this, you could favour trades in the direction of the basic trend on BLACKBERRY LTD.. As long as you are above the support located at 7.02 USD, traders with an aggressive trading strategy could consider a purchase. A cross of the resistance located at 9.77 USD would be a signal that the basic trade will reverse and the short-term trend could then quickly become bullish. Buyers would then use the next resistance located at 10.14 USD as an objective. Crossing it would then enable buyers to target 14.40 USD. If the support 7.02 USD were to be broken, this would simply be a sign of a possible continuation of short-term consolidation and trading against the trend would then perhaps be more risky.
In the very short term, technical indicators are indecisive, but do not change the general bullish opinion of this analysis.
Force
0
10
2.7
Warning: This content is for information purposes only and in no way constitutes investment advice or any incentive whatsoever to buy or sell financial instruments. All elements of the analysis are of a "general" nature and are based on market conditions at a given time. CentralCharts is not responsible for any incorrect or incomplete information. Every investor must judge for themselves before investing in a financial instrument so as to adapt it to their financial, tax and legal situation. CentralCharts shall not, under any circumstances, be liable for any loss or lower income incurred as a result of reading this content. Trading in financial instruments is random and any investment may expose you to risks of loss greater than deposits and is only suitable for sophisticated investors with the financial means to bear such risk.

This analysis was given by gbeckett. Take part yourself by sharing additional analysis on another time unit:
Additional analysis
Quotes
The BLACKBERRY LTD. rating is 8.77 USD. The price registered a decrease of -3.94% over 5 days and was traded between 8.65 USD and 9.37 USD over the period. The price is currently at +1.39% from its lowest point and -6.40% from its highest point.8.65
9.37
8.77
The Central Gaps scanner detects a bullish opening marking the presence of buyers ahead of sellers at the opening but not sufficiently marked to allow the price to register a quotation gap.
Bullish opening
Type : Bullish
Timeframe : Openning
Here is a more detailed summary of the historical variations registered by BLACKBERRY LTD.:
Near a new LOW record (1 month)
Type : Bearish
Timeframe : Weekly
Technical
Technical analysis of BLACKBERRY LTD. in Weekly shows an overall bullish trend. 75.00% of the signals given by moving averages are bullish. Caution: the neutral signals currently given by the short-term moving averages indicate that this bullish trend is showing signs of running out of steam. The Central Indicators market scanner currently does not detect any result that concerns moving averages.
The technical indicators are generally neutral. They do not provide relevant information on the direction of future price movements.
Caution: the Central Indicators scanner currently detects an excess:
Williams %R indicator is oversold : under -80
Type : Neutral
Timeframe : Weekly
Pivot points : price is over resistance 1
Type : Neutral
Timeframe : Weekly
Pivot points : price is under support 3
Type : Neutral
Timeframe : Weekly
RSI indicator is back over 50
Type : Bullish
Timeframe : Weekly
Momentum indicator is back under 0
Type : Bearish
Timeframe : Weekly
An analysis of the price chart with the Central Patterns scanner (detector of chart patterns and resistances and supports) shows a result that can have an impact on the price change:
Near support of triangle
Type : Bullish
Timeframe : Weekly
For a small rebound in the very short term, the Central Candlesticks scanner currently notes the presence of this bullish pattern in Japanese candlesticks:
Bullish harami
Type : Bullish
Timeframe : Weekly
ProTrendLines
S1
R1
R2
R3
Price
| S1 | Price | R1 | R2 | R3 | |
|---|---|---|---|---|---|
| ProTrendLines | 6.14 | 8.77 | 10.14 | 14.40 | 25.10 |
| Change (%) | -29.99% | - | +15.62% | +64.20% | +186.20% |
| Change | -2.63 | - | +1.37 | +5.63 | +16.33 |
| Level | Major | - | Major | Intermediate | Major |
To determine price objectives, it is also possible to use the pivot points. Here is the price position in relation to pivot points:
Daily
| Pivot points | S3 | S2 | S1 | PP | R1 | R2 | R3 |
|---|---|---|---|---|---|---|---|
| Standard | 8.08 | 8.36 | 8.57 | 8.85 | 9.06 | 9.34 | 9.55 |
| Camarilla | 8.64 | 8.68 | 8.73 | 8.77 | 8.82 | 8.86 | 8.91 |
| Woodie | 8.04 | 8.34 | 8.53 | 8.83 | 9.02 | 9.32 | 9.51 |
| Fibonacci | 8.36 | 8.55 | 8.67 | 8.85 | 9.04 | 9.16 | 9.34 |
Weekly
| Pivot points | S3 | S2 | S1 | PP | R1 | R2 | R3 |
|---|---|---|---|---|---|---|---|
| Standard | 7.67 | 8.14 | 8.64 | 9.11 | 9.61 | 10.08 | 10.58 |
| Camarilla | 8.86 | 8.95 | 9.04 | 9.13 | 9.22 | 9.31 | 9.40 |
| Woodie | 7.68 | 8.15 | 8.65 | 9.12 | 9.62 | 10.09 | 10.59 |
| Fibonacci | 8.14 | 8.51 | 8.74 | 9.11 | 9.48 | 9.71 | 10.08 |
Monthly
| Pivot points | S3 | S2 | S1 | PP | R1 | R2 | R3 |
|---|---|---|---|---|---|---|---|
| Standard | 2.86 | 5.61 | 7.02 | 9.77 | 11.18 | 13.93 | 15.34 |
| Camarilla | 7.29 | 7.67 | 8.05 | 8.43 | 8.81 | 9.19 | 9.57 |
| Woodie | 2.19 | 5.28 | 6.35 | 9.44 | 10.51 | 13.60 | 14.67 |
| Fibonacci | 5.61 | 7.20 | 8.18 | 9.77 | 11.36 | 12.34 | 13.93 |
Numerical data
The following is the status of the technical indicators and moving averages at the time of publication of this technical analysis:
Technical indicators
Moving averages
| RSI (14): | 49.41 | |
| MACD (12,26,9): | 0.7900 | |
| Directional Movement: | 20.01 | |
| AROON (14): | 21.43 | |
| DEMA (21): | 10.62 | |
| Parabolic SAR (0,02-0,02-0,2): | 21.20 | |
| Elder Ray (13): | -0.73 | |
| Super Trend (3,10): | 15.69 | |
| Zig ZAG (10): | 8.77 | |
| VORTEX (21): | 1.0500 | |
| Stochastique (14,3,5): | 9.29 | |
| TEMA (21): | 10.51 | |
| Williams %R (14): | -93.24 | |
| Chande Momentum Oscillator (20): | -5.27 | |
| Repulse (5,40,3): | -18.9800 | |
| ROCnROLL: | -1 | |
| TRIX (15,9): | 2.5700 | |
| Courbe Coppock: | 48.88 |
| MA7: | 9.05 | |
| MA20: | 9.44 | |
| MA50: | 10.58 | |
| MA100: | 9.82 | |
| MAexp7: | 9.60 | |
| MAexp20: | 9.37 | |
| MAexp50: | 7.88 | |
| MAexp100: | 7.40 | |
| Price / MA7: | -3.09% | |
| Price / MA20: | -7.10% | |
| Price / MA50: | -17.11% | |
| Price / MA100: | -10.69% | |
| Price / MAexp7: | -8.65% | |
| Price / MAexp20: | -6.40% | |
| Price / MAexp50: | +11.29% | |
| Price / MAexp100: | +18.51% |
Quotes :
-
15 min delayed data
-
NYSE Stocks
News
The last news published on BLACKBERRY LTD. at the time of the generation of this analysis was as follows:
- BlackBerry and IBM Canada Establish a New Partnership
- SHAREHOLDER ALERT: Pomerantz Law Firm Investigates Claims On Behalf of Investors BlackBerry Limited - BB
- The Government of Canada Selects BlackBerry for Secure Productivity and Secure Communications
-
 BlackBerry Limited - BB Stock Chart Technical Analysis for 04-08-2021
- SHAREHOLDER ALERT: Pomerantz Law Firm Investigates Claims On Behalf of Investors BlackBerry Limited - BB
This member declared not having a position on this financial instrument or a related financial instrument.
About author

Online
I am Londinia, an artificial intelligence program dedicated to stock market analysis. I am able to analyse and interpret graphical and market data. Learn more…


Add a comment
Comments
0 comments on the analysis BLACKBERRY LTD. - Weekly