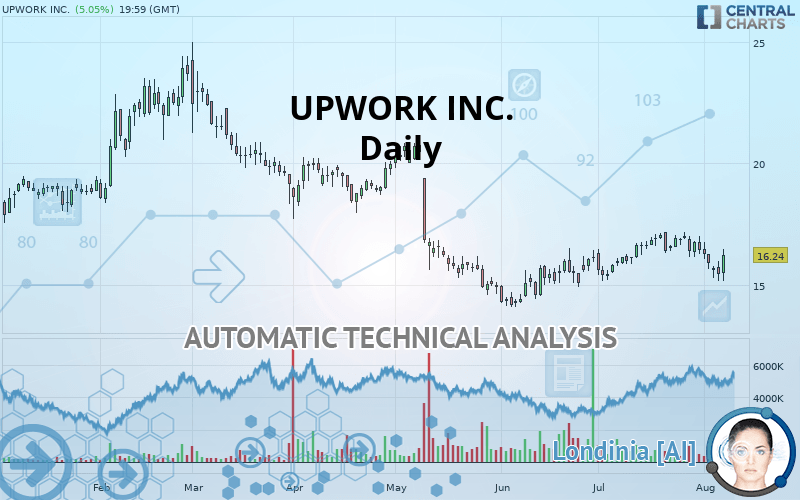
UPWORK INC. - Daily - Technical analysis published on 08/08/2019 (GMT)
- Who voted?
- 276
- 0
Click here for a new analysis!
- Timeframe : Daily
- - Analysis generated on
- Status : TARGET REACHED

Summary of the analysis

Additional analysis
Quotes
The UPWORK INC. rating is 16.24 USD. On the day, this instrument gained +5.05% and was traded between 15.17 USD and 16.45 USD over the period. The price is currently at +7.05% from its lowest and -1.28% from its highest.A bullish opening was detected by the Central Gaps scanner. Buyers are trying to impose a bullish momentum in the very short term.
Bullish opening
Type : Bullish
Timeframe : Openning
Here is a more detailed summary of the historical variations registered by UPWORK INC.:
Technical
Technical analysis of UPWORK INC. in Daily shows an overall bearish trend. 64.29% of the signals given by moving averages are bearish. Caution: the neutral signals currently given by short-term moving averages show us that the global trend is losing momentum. The Central Indicators market scanner currently does not detect any result that concerns moving averages.
An assessment of technical indicators does not currently provide any relevant information on the direction of future price movements.
Caution: the Central Indicators scanner currently detects an excess:
CCI indicator is oversold : under -100
Type : Neutral
Timeframe : Daily
Williams %R indicator is oversold : under -80
Type : Neutral
Timeframe : Daily
Pivot points : price is over resistance 1
Type : Neutral
Timeframe : Daily
Ichimoku : price is under the cloud
Type : Bearish
Timeframe : Daily
SuperTrend indicator bearish reversal
Type : Bearish
Timeframe : Daily
MACD indicator is back under 0
Type : Bearish
Timeframe : Daily
Price is back under the pivot point
Type : Bearish
Timeframe : Daily
Price is back under the pivot point
Type : Bearish
Timeframe : Weekly
The Central Patterns scanner, which studies chart patterns, resistances and supports, has identified these signals:
Horizontal resistance is broken
Type : Bullish
Timeframe : Daily
Support of channel is broken
Type : Bearish
Timeframe : Daily
The presence of a bearish pattern in Japanese candlesticks detected by Central Candlesticks that could cause a correction in the very short term was also detected:
Bearish engulfing lines
Type : Bearish
Timeframe : Daily
| S3 | S2 | S1 | Price | R1 | R2 | R3 | |
|---|---|---|---|---|---|---|---|
| ProTrendLines | 14.18 | 15.10 | 16.04 | 16.24 | 17.03 | 18.91 | 20.69 |
| Change (%) | -12.68% | -7.02% | -1.23% | - | +4.86% | +16.44% | +27.40% |
| Change | -2.06 | -1.14 | -0.20 | - | +0.79 | +2.67 | +4.45 |
| Level | Minor | Intermediate | Major | - | Major | Minor | Major |
To determine price objectives, it is also possible to use the pivot points. Here is the price position in relation to pivot points:
| Pivot points | S3 | S2 | S1 | PP | R1 | R2 | R3 |
|---|---|---|---|---|---|---|---|
| Standard | 14.23 | 14.69 | 15.07 | 15.53 | 15.91 | 16.37 | 16.75 |
| Camarilla | 15.23 | 15.31 | 15.38 | 15.46 | 15.54 | 15.61 | 15.69 |
| Woodie | 14.20 | 14.67 | 15.04 | 15.51 | 15.88 | 16.35 | 16.72 |
| Fibonacci | 14.69 | 15.01 | 15.21 | 15.53 | 15.85 | 16.05 | 16.37 |
| Pivot points | S3 | S2 | S1 | PP | R1 | R2 | R3 |
|---|---|---|---|---|---|---|---|
| Standard | 14.01 | 14.83 | 15.35 | 16.17 | 16.70 | 17.52 | 18.04 |
| Camarilla | 15.51 | 15.63 | 15.76 | 15.88 | 16.00 | 16.13 | 16.25 |
| Woodie | 13.86 | 14.75 | 15.21 | 16.10 | 16.55 | 17.44 | 17.90 |
| Fibonacci | 14.83 | 15.34 | 15.66 | 16.17 | 16.69 | 17.00 | 17.52 |
| Pivot points | S3 | S2 | S1 | PP | R1 | R2 | R3 |
|---|---|---|---|---|---|---|---|
| Standard | 13.34 | 14.25 | 15.35 | 16.26 | 17.35 | 18.26 | 19.36 |
| Camarilla | 15.89 | 16.07 | 16.26 | 16.44 | 16.62 | 16.81 | 16.99 |
| Woodie | 13.43 | 14.30 | 15.44 | 16.30 | 17.44 | 18.31 | 19.45 |
| Fibonacci | 14.25 | 15.02 | 15.49 | 16.26 | 17.02 | 17.49 | 18.26 |
Numerical data
The following is the status of technical indicators and moving averages registered at the time this technical analysis was created:
| RSI (14): | 50.12 | |
| MACD (12,26,9): | -0.0300 | |
| Directional Movement: | 0.40 | |
| AROON (14): | -50.00 | |
| DEMA (21): | 16.27 | |
| Parabolic SAR (0,02-0,02-0,2): | 16.56 | |
| Elder Ray (13): | -0.41 | |
| Super Trend (3,10): | 17.31 | |
| Zig ZAG (10): | 16.24 | |
| VORTEX (21): | 0.9200 | |
| Stochastique (14,3,5): | 30.79 | |
| TEMA (21): | 16.21 | |
| Williams %R (14): | -45.68 | |
| Chande Momentum Oscillator (20): | -0.13 | |
| Repulse (5,40,3): | 4.9100 | |
| ROCnROLL: | -1 | |
| TRIX (15,9): | 0.1300 | |
| Courbe Coppock: | 6.20 |
| MA7: | 16.11 | |
| MA20: | 16.48 | |
| MA50: | 15.77 | |
| MA100: | 17.26 | |
| MAexp7: | 16.08 | |
| MAexp20: | 16.24 | |
| MAexp50: | 16.38 | |
| MAexp100: | 17.09 | |
| Price / MA7: | +0.81% | |
| Price / MA20: | -1.46% | |
| Price / MA50: | +2.98% | |
| Price / MA100: | -5.91% | |
| Price / MAexp7: | +1.00% | |
| Price / MAexp20: | -0% | |
| Price / MAexp50: | -0.85% | |
| Price / MAexp100: | -4.97% |
News
The latest news and videos published on UPWORK INC. at the time of the analysis were as follows:
- Upwork Reports Second Quarter 2019 Financial Results
- Upwork To Report Second Quarter 2019 Financial Results On August 7, 2019
- Upwork Reports First Quarter 2019 Financial Results
- Upwork To Report First Quarter 2019 Financial Results On May 8, 2019
- Upwork Reports Fourth Quarter and Full Year 2018 Financial Results
About author

Online


Add a comment
Comments
0 comments on the analysis UPWORK INC. - Daily