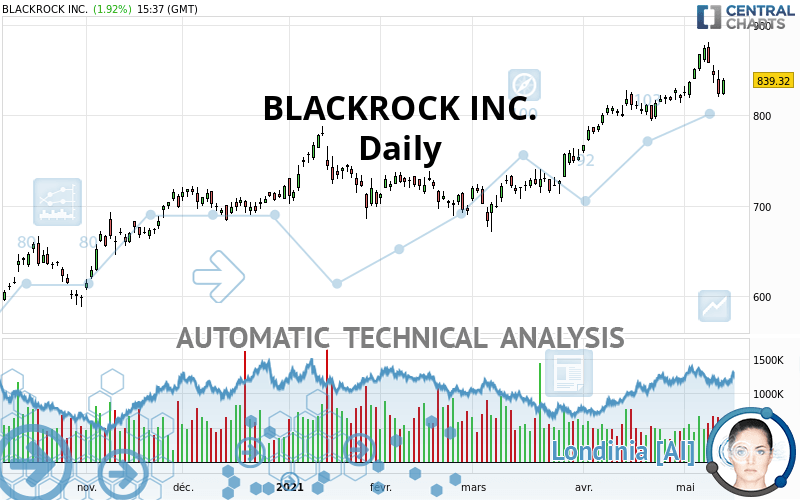
BLACKROCK INC. - Daily - Technical analysis published on 05/13/2021 (GMT)
- 239
- 0
Click here for a new analysis!
- Timeframe : Daily
- - Analysis generated on
- Status : TARGET REACHED

Summary of the analysis

Additional analysis
Quotes
BLACKROCK INC. rating 839.32 USD. On the day, this instrument gained +1.92% with the lowest point at 822.10 USD and the highest point at 840.87 USD. The deviation from the price is +2.09% for the low point and -0.18% for the high point.So that you have an overall view of the price change, here is a table showing the variations over several periods:
New HIGH record (5 years)
Type : Bullish
Timeframe : Weekly
Near a new HIGH record (1 year)
Type : Bullish
Timeframe : Weekly
Near a new HIGH record (1st january)
Type : Bullish
Timeframe : Weekly
Technical
A technical analysis in Daily of this BLACKROCK INC. chart shows a strongly bullish trend. 92.86% of the signals given by moving averages are bullish. The overall trend is supported by the strong bullish signals from short-term moving averages. The Central Indicators scanner detects bearish signals on moving averages that could impact this trend:
Bearish price crossover with Moving Average 20
Type : Bearish
Timeframe : Daily
Bearish price crossover with adaptative moving average 20
Type : Bearish
Timeframe : Daily
In fact, Central Analyzer took into account 18 technical indicators and the result was as follows: 6 are bullish, 8 are neutral and 4 are bearish. Other results related to technical indicators were also found by the Central Indicators scanner:
MACD crosses DOWN its Moving Average
Type : Bearish
Timeframe : Daily
Parabolic SAR indicator bearish reversal
Type : Bearish
Timeframe : Daily
Price is back over the pivot point
Type : Bullish
Timeframe : Weekly
Price is back under the pivot point
Type : Bearish
Timeframe : Daily
Williams %R indicator is back under -50
Type : Bearish
Timeframe : Daily
An analysis of the price chart with the Central Patterns scanner (detector of chart patterns and resistances and supports) shows a result that can have an impact on the price change:
Resistance of channel is broken
Type : Bullish
Timeframe : Daily
The Central Candlesticks scanner, specialised in Japanese candlesticks, did not identify any signals.
| S3 | S2 | S1 | Price | |
|---|---|---|---|---|
| ProTrendLines | 593.26 | 683.21 | 779.75 | 839.32 |
| Change (%) | -29.32% | -18.60% | -7.10% | - |
| Change | -246.06 | -156.11 | -59.57 | - |
| Level | Major | Intermediate | Major | - |
To determine price objectives, it is also possible to use the pivot points. Here is the price position in relation to pivot points:
| Pivot points | S3 | S2 | S1 | PP | R1 | R2 | R3 |
|---|---|---|---|---|---|---|---|
| Standard | 782.26 | 801.10 | 812.30 | 831.14 | 842.34 | 861.18 | 872.38 |
| Camarilla | 815.24 | 817.99 | 820.75 | 823.50 | 826.25 | 829.01 | 831.76 |
| Woodie | 778.44 | 799.19 | 808.48 | 829.23 | 838.52 | 859.27 | 868.56 |
| Fibonacci | 801.10 | 812.58 | 819.67 | 831.14 | 842.62 | 849.71 | 861.18 |
| Pivot points | S3 | S2 | S1 | PP | R1 | R2 | R3 |
|---|---|---|---|---|---|---|---|
| Standard | 778.14 | 798.57 | 836.20 | 856.63 | 894.26 | 914.69 | 952.32 |
| Camarilla | 857.86 | 863.19 | 868.51 | 873.83 | 879.15 | 884.47 | 889.80 |
| Woodie | 786.74 | 802.87 | 844.80 | 860.93 | 902.86 | 918.99 | 960.92 |
| Fibonacci | 798.57 | 820.75 | 834.45 | 856.63 | 878.81 | 892.51 | 914.69 |
| Pivot points | S3 | S2 | S1 | PP | R1 | R2 | R3 |
|---|---|---|---|---|---|---|---|
| Standard | 702.85 | 730.23 | 774.76 | 802.14 | 846.67 | 874.05 | 918.58 |
| Camarilla | 799.53 | 806.12 | 812.71 | 819.30 | 825.89 | 832.48 | 839.08 |
| Woodie | 711.44 | 734.52 | 783.35 | 806.43 | 855.26 | 878.34 | 927.17 |
| Fibonacci | 730.23 | 757.70 | 774.67 | 802.14 | 829.61 | 846.58 | 874.05 |
Numerical data
The following is the status of technical indicators and moving averages registered at the time this technical analysis was created:
| RSI (14): | 57.56 | |
| MACD (12,26,9): | 18.0100 | |
| Directional Movement: | 7.71 | |
| AROON (14): | 78.57 | |
| DEMA (21): | 853.51 | |
| Parabolic SAR (0,02-0,02-0,2): | 879.58 | |
| Elder Ray (13): | -5.33 | |
| Super Trend (3,10): | 822.82 | |
| Zig ZAG (10): | 839.59 | |
| VORTEX (21): | 1.0100 | |
| Stochastique (14,3,5): | 43.30 | |
| TEMA (21): | 853.02 | |
| Williams %R (14): | -61.16 | |
| Chande Momentum Oscillator (20): | 18.74 | |
| Repulse (5,40,3): | 0.0900 | |
| ROCnROLL: | 1 | |
| TRIX (15,9): | 0.3800 | |
| Courbe Coppock: | 8.74 |
| MA7: | 850.82 | |
| MA20: | 828.43 | |
| MA50: | 780.80 | |
| MA100: | 749.14 | |
| MAexp7: | 841.72 | |
| MAexp20: | 828.09 | |
| MAexp50: | 792.87 | |
| MAexp100: | 752.94 | |
| Price / MA7: | -1.35% | |
| Price / MA20: | +1.31% | |
| Price / MA50: | +7.49% | |
| Price / MA100: | +12.04% | |
| Price / MAexp7: | -0.29% | |
| Price / MAexp20: | +1.36% | |
| Price / MAexp50: | +5.86% | |
| Price / MAexp100: | +11.47% |
News
Don't forget to follow the news on BLACKROCK INC.. At the time of publication of this analysis, the latest news was as follows:
- BlackRock Smaller Companies Trust Plc - Submission of Documents
- BlackRock World Mining Trust Plc - Director/PDMR Shareholding
- BlackRock Throgmorton Trust Plc - Portfolio Update
- BlackRock Latin American Investment Trust Plc - Blocklisting - Interim Review
- BlackRock Throgmorton Trust Plc - Disclosure of Portfolio Holdings
About author

Online


Add a comment
Comments
0 comments on the analysis BLACKROCK INC. - Daily