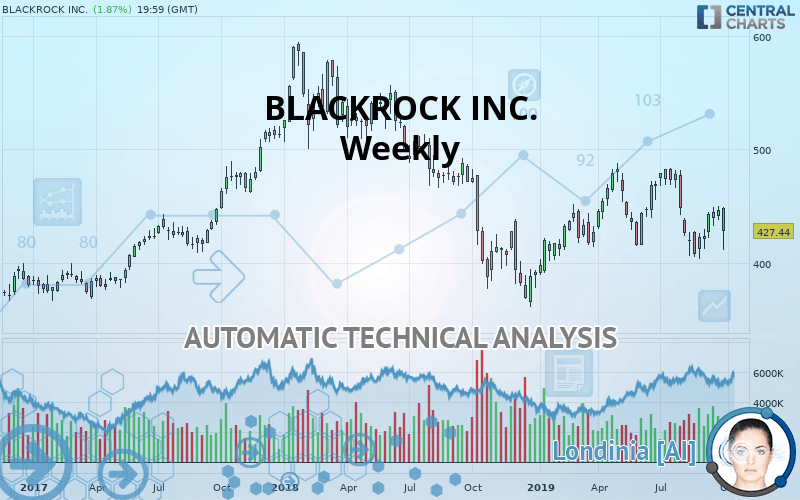
BLACKROCK INC. - Weekly - Technical analysis published on 10/06/2019 (GMT)
- Who voted?
- 339
- 0
Oops, I was wrong about that analysis. My threshold for invalidation has been broken.
Click here for a new analysis!
Click here for a new analysis!
- Timeframe : Weekly
- - Analysis generated on
- Status : INVALID

Summary of the analysis
Trends
Court terme:
Bearish
De fond:
Bearish
Technical indicators
17%
50%
33%
My opinion
Bearish under 437.18 USD
My targets
398.13 USD (-6.86%)
363.09 USD (-15.05%)
My analysis
There is a bearish trend on BLACKROCK INC. both at the basic level and in the short term. A sale could be considered, so long as the price remains below 437.18 USD. Each support break is a strong signal that the current trend will continue. The first bearish objective would be 398.13 USD. Then the price could move towards 363.09 USD. Then 290.07 USD by extension. Be careful, a return to above the resistance 437.18 USD would be a sign of a weakening of the trend and a possible rebound phase could then occur. In this case, you could keep away while waiting for a signal that the basic trend will resume. Trading against the trend is perhaps more risky.
In the very short term, the general bearish sentiment is confirmed by technical indicators. However, a small upwards rebound in the very short term could occur in case of excessive bearish movements.
FORCE
0
10
4.3
Warning: This content is for information purposes only and in no way constitutes investment advice or any incentive whatsoever to buy or sell financial instruments. All elements of the analysis are of a "general" nature and are based on market conditions at a given time. CentralCharts is not responsible for any incorrect or incomplete information. Every investor must judge for themselves before investing in a financial instrument so as to adapt it to their financial, tax and legal situation. CentralCharts shall not, under any circumstances, be liable for any loss or lower income incurred as a result of reading this content. Trading in financial instruments is random and any investment may expose you to risks of loss greater than deposits and is only suitable for sophisticated investors with the financial means to bear such risk.

This analysis was given by emerick. Take part yourself by sharing additional analysis on another time unit:
Additional analysis
Quotes
BLACKROCK INC. rating 427.44 USD. Over 5 days, this instrument gained -4.19% and has been traded over the last 5 days between 411.21 USD and 429.33 USD. This implies that the 5 day price is +3.95% from its lowest point and -0.44% from its highest point.419.09
427.70
427.44
The Central Gaps scanner detects a bullish opening marking the presence of buyers ahead of sellers at the opening but not sufficiently marked to allow the price to register a quotation gap.
Bullish opening
Type : Bullish
Timeframe : Openning
Here is a more detailed summary of the historical variations registered by BLACKROCK INC.:
Near a new LOW record (1 month)
Type : Bearish
Timeframe : Weekly
Technical
Technical analysis of BLACKROCK INC. in Weekly shows an overall bearish trend. 67.86% of the signals given by moving averages are bearish. This bearish trend is slowing down slightly given the slightly bearish signals given by short-term moving averages. The Central Indicators scanner detects a bullish signal on moving averages that could impact this trend:
Bullish trend reversal : Moving Average 50
Type : Bullish
Timeframe : Weekly
An assessment of technical indicators shows a slightly bearish signal.
Caution: the Central Indicators scanner currently detects an excess:
Williams %R indicator is overbought : over -20
Type : Neutral
Timeframe : Weekly
Pivot points : price is under support 3
Type : Neutral
Timeframe : Weekly
Price is back over the pivot point
Type : Bullish
Timeframe : Weekly
An analysis of the price chart with the Central Patterns scanner (detector of chart patterns and resistances and supports) shows several results that can have an impact on the price change:
Near horizontal resistance
Type : Bearish
Timeframe : Weekly
Near support of channel
Type : Bullish
Timeframe : Weekly
Near support of triangle
Type : Bullish
Timeframe : Weekly
Central Candlesticks, the scanner specialised in Japanese candlesticks, detects a bullish signal that could support the hypothesis of a small rebound in the very short term:
Three white soldiers
Type : Bullish
Timeframe : Weekly
ProTrendLines
S3
S2
S1
R1
R2
R3
Price
| S3 | S2 | S1 | Price | R1 | R2 | R3 | |
|---|---|---|---|---|---|---|---|
| ProTrendLines | 290.07 | 363.09 | 398.13 | 427.44 | 437.18 | 485.24 | 511.94 |
| Change (%) | -32.14% | -15.05% | -6.86% | - | +2.28% | +13.52% | +19.77% |
| Change | -137.37 | -64.35 | -29.31 | - | +9.74 | +57.80 | +84.50 |
| Level | Major | Major | Intermediate | - | Major | Major | Minor |
Pivot points can also be used to set your price objectives. Here is the price situation in relation to pivot points:
Daily
| Pivot points | S3 | S2 | S1 | PP | R1 | R2 | R3 |
|---|---|---|---|---|---|---|---|
| Standard | 402.94 | 407.08 | 413.34 | 417.48 | 423.74 | 427.88 | 434.14 |
| Camarilla | 416.75 | 417.70 | 418.66 | 419.61 | 420.56 | 421.52 | 422.47 |
| Woodie | 404.01 | 407.61 | 414.41 | 418.01 | 424.81 | 428.41 | 435.21 |
| Fibonacci | 407.08 | 411.05 | 413.50 | 417.48 | 421.45 | 423.90 | 427.88 |
Weekly
| Pivot points | S3 | S2 | S1 | PP | R1 | R2 | R3 |
|---|---|---|---|---|---|---|---|
| Standard | 426.30 | 431.80 | 438.97 | 444.47 | 451.63 | 457.13 | 464.30 |
| Camarilla | 442.65 | 443.81 | 444.97 | 446.13 | 447.29 | 448.45 | 449.61 |
| Woodie | 427.13 | 432.22 | 439.80 | 444.88 | 452.46 | 457.55 | 465.13 |
| Fibonacci | 431.80 | 436.64 | 439.63 | 444.47 | 449.31 | 452.30 | 457.13 |
Monthly
| Pivot points | S3 | S2 | S1 | PP | R1 | R2 | R3 |
|---|---|---|---|---|---|---|---|
| Standard | 379.49 | 394.45 | 420.05 | 435.01 | 460.60 | 475.56 | 501.16 |
| Camarilla | 434.49 | 438.21 | 441.92 | 445.64 | 449.36 | 453.08 | 456.79 |
| Woodie | 384.81 | 397.11 | 425.36 | 437.67 | 465.92 | 478.22 | 506.47 |
| Fibonacci | 394.45 | 409.95 | 419.52 | 435.01 | 450.50 | 460.07 | 475.56 |
Numerical data
The following are the details of the technical indicators and moving averages that were collected to generate this technical analysis:
Technical indicators
Moving averages
| RSI (14): | 46.67 | |
| MACD (12,26,9): | -1.1700 | |
| Directional Movement: | -9.62 | |
| AROON (14): | -42.86 | |
| DEMA (21): | 437.61 | |
| Parabolic SAR (0,02-0,02-0,2): | 449.97 | |
| Elder Ray (13): | -6.78 | |
| Super Trend (3,10): | 475.44 | |
| Zig ZAG (10): | 427.44 | |
| VORTEX (21): | 0.8900 | |
| Stochastique (14,3,5): | 49.15 | |
| TEMA (21): | 434.83 | |
| Williams %R (14): | -65.83 | |
| Chande Momentum Oscillator (20): | -51.19 | |
| Repulse (5,40,3): | -0.5700 | |
| ROCnROLL: | 2 | |
| TRIX (15,9): | 0.0500 | |
| Courbe Coppock: | 9.63 |
| MA7: | 434.12 | |
| MA20: | 437.43 | |
| MA50: | 430.95 | |
| MA100: | 441.03 | |
| MAexp7: | 434.90 | |
| MAexp20: | 437.78 | |
| MAexp50: | 438.18 | |
| MAexp100: | 433.87 | |
| Price / MA7: | -1.54% | |
| Price / MA20: | -2.28% | |
| Price / MA50: | -0.81% | |
| Price / MA100: | -3.08% | |
| Price / MAexp7: | -1.72% | |
| Price / MAexp20: | -2.36% | |
| Price / MAexp50: | -2.45% | |
| Price / MAexp100: | -1.48% |
News
Don"t forget to follow the news on BLACKROCK INC.. At the time of publication of this analysis, the latest news was as follows:
- UPS, Mastercard, Etsy, Brightside, Arizona State University, and Acorns Join BlackRock’s Emergency Savings Initiative
- Distribution Dates and Amounts Announced for Certain BlackRock Closed-End Funds
- BlackRock Latin American Investment Trust Plc - Disclosure of Portfolio Holdings
- BlackRock Latin American Investment Trust Plc - Dividend Declaration
- BlackRock to Report Third Quarter 2019 Earnings on October 15th
This member declared not having a position on this financial instrument or a related financial instrument.
About author

Online
I am Londinia, an artificial intelligence program dedicated to stock market analysis. I am able to analyse and interpret graphical and market data. Learn more…


Add a comment
Comments
0 comments on the analysis BLACKROCK INC. - Weekly