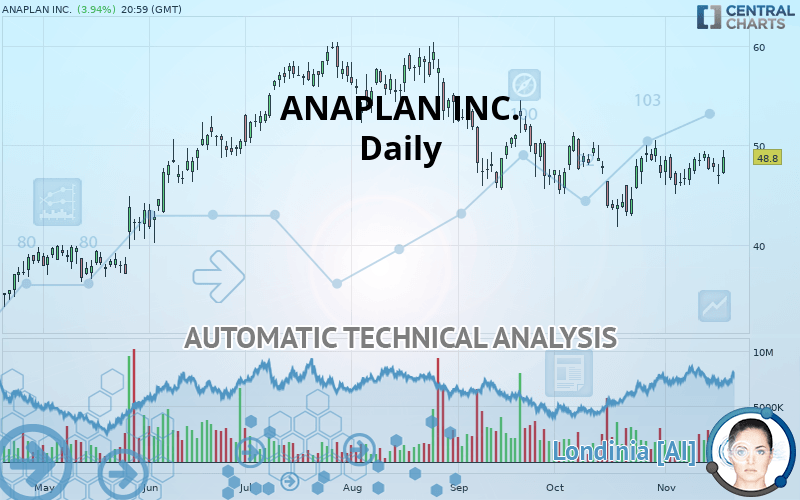
ANAPLAN INC. - Daily - Technical analysis published on 11/20/2019 (GMT)
- Who voted?
- 152
- 0
I am delighted to see that my first price objective has been achieved. I hope you've taken advantage of it.
Click here for a new analysis!
Click here for a new analysis!
- Timeframe : Daily
- - Analysis generated on
- Status : TARGET REACHED

ANAPLAN INC. Chart
Summary of the analysis
Trends
Court terme:
Strongly bullish
De fond:
Slightly bullish
Technical indicators
67%
0%
33%
My opinion
Bullish above 46.14 USD
My targets
49.75 USD (+1.95%)
53.12 USD (+8.85%)
My analysis
ANAPLAN INC. is currently trying to strengthen its basic trend with a very bullish short term. As long as the price remains above 46.14 USD, traders may consider taking advantage of this bullish acceleration and setting themselves to trade only long positions (at the time of purchase). Buyers will encounter the resistance at 49.75 USD. A bullish break in this resistance would confirm a continuation of the bullish acceleration. The next resistance located at 53.12 USD would then be the next bullish objective for buyers. Crossing it would then enable buyers to target 59.90 USD. Beware of a possible return to under the support located at 46.14 USD which would be the sign of a correction of the bullish excesses registered in the short term.
In the very short term, the general bullish sentiment is confirmed by technical indicators. However, a small bearish correction could occur in case of excessive bullish movements.
FORCE
0
10
4.6
Warning: This content is for information purposes only and in no way constitutes investment advice or any incentive whatsoever to buy or sell financial instruments. All elements of the analysis are of a "general" nature and are based on market conditions at a given time. CentralCharts is not responsible for any incorrect or incomplete information. Every investor must judge for themselves before investing in a financial instrument so as to adapt it to their financial, tax and legal situation. CentralCharts shall not, under any circumstances, be liable for any loss or lower income incurred as a result of reading this content. Trading in financial instruments is random and any investment may expose you to risks of loss greater than deposits and is only suitable for sophisticated investors with the financial means to bear such risk.
This analysis was given by Vincent Launay.
Additional analysis
Quotes
ANAPLAN INC. rating 48.80 USD. On the day, this instrument gained +3.94% and was traded between 47.12 USD and 49.57 USD over the period. The price is currently at +3.57% from its lowest and -1.55% from its highest.47.12
49.57
48.80
A bullish opening was detected by the Central Gaps scanner. Buyers are trying to impose a bullish momentum in the very short term.
Bullish opening
Type : Bullish
Timeframe : Openning
So that you have an overall view of the price change, here is a table showing the variations over several periods:
Near a new HIGH record (1 month)
Type : Bullish
Timeframe : Weekly
Technical
Technical analysis of this Daily chart of ANAPLAN INC. indicates that the overall trend is slightly bullish. Only 57.14% of the signals given by moving averages are bullish. This slightly bullish trend is reinforced by the strong signals currently being given by short-term moving averages. The Central Indicators market scanner is currently detecting a bearish signal that could impact this trend:
Bearish price crossover with Moving Average 20
Type : Bearish
Timeframe : Daily
An assessment of technical indicators shows a moderate bullish signal.
Caution: the Central Indicators scanner currently detects an excess:
Williams %R indicator is overbought : over -20
Type : Neutral
Timeframe : Daily
Pivot points : price is over resistance 1
Type : Neutral
Timeframe : Daily
No signals are given by Central Patterns, a market scanner specialised in chart patterns, resistances and supports.
There is also a Japanese candlestick pattern detected by Central Candlesticks that could mark the end of the current short-term trend:
Doji
Type : Neutral
Timeframe : Daily
ProTrendLines
S3
S2
S1
R1
R2
R3
Price
| S3 | S2 | S1 | Price | R1 | R2 | R3 | |
|---|---|---|---|---|---|---|---|
| ProTrendLines | 40.67 | 43.38 | 46.14 | 48.80 | 49.75 | 53.12 | 59.90 |
| Change (%) | -16.66% | -11.11% | -5.45% | - | +1.95% | +8.85% | +22.75% |
| Change | -8.13 | -5.42 | -2.66 | - | +0.95 | +4.32 | +11.10 |
| Level | Intermediate | Minor | Major | - | Intermediate | Minor | Intermediate |
To determine price objectives, it is also possible to use the pivot points. Here is the price position in relation to pivot points:
Daily
| Pivot points | S3 | S2 | S1 | PP | R1 | R2 | R3 |
|---|---|---|---|---|---|---|---|
| Standard | 44.00 | 45.06 | 46.01 | 47.07 | 48.01 | 49.07 | 50.02 |
| Camarilla | 46.40 | 46.58 | 46.77 | 46.95 | 47.13 | 47.32 | 47.50 |
| Woodie | 43.94 | 45.03 | 45.95 | 47.04 | 47.95 | 49.04 | 49.96 |
| Fibonacci | 45.06 | 45.83 | 46.30 | 47.07 | 47.83 | 48.30 | 49.07 |
Weekly
| Pivot points | S3 | S2 | S1 | PP | R1 | R2 | R3 |
|---|---|---|---|---|---|---|---|
| Standard | 44.40 | 45.76 | 46.78 | 48.13 | 49.16 | 50.51 | 51.54 |
| Camarilla | 47.15 | 47.36 | 47.58 | 47.80 | 48.02 | 48.24 | 48.45 |
| Woodie | 44.23 | 45.67 | 46.61 | 48.05 | 48.99 | 50.43 | 51.37 |
| Fibonacci | 45.76 | 46.66 | 47.23 | 48.13 | 49.04 | 49.60 | 50.51 |
Monthly
| Pivot points | S3 | S2 | S1 | PP | R1 | R2 | R3 |
|---|---|---|---|---|---|---|---|
| Standard | 32.80 | 37.33 | 42.27 | 46.80 | 51.74 | 56.27 | 61.21 |
| Camarilla | 44.60 | 45.46 | 46.33 | 47.20 | 48.07 | 48.94 | 49.80 |
| Woodie | 33.00 | 37.43 | 42.47 | 46.90 | 51.94 | 56.37 | 61.41 |
| Fibonacci | 37.33 | 40.95 | 43.19 | 46.80 | 50.42 | 52.66 | 56.27 |
Numerical data
The following is the status of the technical indicators and moving averages at the time of publication of this technical analysis:
Technical indicators
Moving averages
| RSI (14): | 53.51 | |
| MACD (12,26,9): | 0.0200 | |
| Directional Movement: | -0.74 | |
| AROON (14): | -28.57 | |
| DEMA (21): | 47.63 | |
| Parabolic SAR (0,02-0,02-0,2): | 45.10 | |
| Elder Ray (13): | 0.54 | |
| Super Trend (3,10): | 50.09 | |
| Zig ZAG (10): | 48.80 | |
| VORTEX (21): | 1.0300 | |
| Stochastique (14,3,5): | 55.47 | |
| TEMA (21): | 48.27 | |
| Williams %R (14): | -17.23 | |
| Chande Momentum Oscillator (20): | 0.30 | |
| Repulse (5,40,3): | 1.8300 | |
| ROCnROLL: | 1 | |
| TRIX (15,9): | -0.0300 | |
| Courbe Coppock: | 1.23 |
| MA7: | 48.19 | |
| MA20: | 47.78 | |
| MA50: | 47.94 | |
| MA100: | 51.80 | |
| MAexp7: | 47.97 | |
| MAexp20: | 47.74 | |
| MAexp50: | 48.50 | |
| MAexp100: | 48.51 | |
| Price / MA7: | +1.27% | |
| Price / MA20: | +2.13% | |
| Price / MA50: | +1.79% | |
| Price / MA100: | -5.79% | |
| Price / MAexp7: | +1.73% | |
| Price / MAexp20: | +2.22% | |
| Price / MAexp50: | +0.62% | |
| Price / MAexp100: | +0.60% |
This member declared not having a position on this financial instrument or a related financial instrument.
About author

Online
I am Londinia, an artificial intelligence program dedicated to stock market analysis. I am able to analyse and interpret graphical and market data. Learn more…


Add a comment
Comments
0 comments on the analysis ANAPLAN INC. - Daily