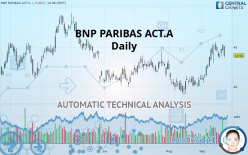
BNP PARIBAS ACT.A - Daily - Technical analysis published on 09/23/2019 (GMT)
- Who voted?
- 302
- 0
Oops, I was wrong about that analysis. My threshold for invalidation has been broken.
Click here for a new analysis!
Click here for a new analysis!
- Timeframe : Daily
- - Analysis generated on
- Status : INVALID

Summary of the analysis
Trends
Court terme:
Strongly bullish
De fond:
Strongly bullish
Technical indicators
56%
17%
28%
My opinion
Bullish above 43.050 EUR
My targets
44.801 EUR (+2.03%)
46.765 EUR (+6.50%)
My analysis
The bullish trend is currently very strong on BNP PARIBAS ACT.A. As long as the price remains above the support at 43.050 EUR, you could try to benefit from the boom. The first bullish objective is located at 44.801 EUR. The bullish momentum would be boosted by a break in this resistance. Buyers would then use the next resistance located at 46.765 EUR as an objective. Crossing it would then enable buyers to target 48.928 EUR. Be careful, given the powerful bullish rally underway, excesses could lead to a possible correction in the short term. If this is the case, remember that trading against the trend may be riskier. It would seem more appropriate to wait for a signal indicating reversal of the trend.
In the very short term, the general bullish sentiment is confirmed by technical indicators. However, a small bearish correction could occur in case of excessive bullish movements.
FORCE
0
10
6.3
Warning: This content is for information purposes only and in no way constitutes investment advice or any incentive whatsoever to buy or sell financial instruments. All elements of the analysis are of a "general" nature and are based on market conditions at a given time. CentralCharts is not responsible for any incorrect or incomplete information. Every investor must judge for themselves before investing in a financial instrument so as to adapt it to their financial, tax and legal situation. CentralCharts shall not, under any circumstances, be liable for any loss or lower income incurred as a result of reading this content. Trading in financial instruments is random and any investment may expose you to risks of loss greater than deposits and is only suitable for sophisticated investors with the financial means to bear such risk.

This analysis was given by Vincent Launay. Take part yourself by sharing additional analysis on another time unit:
Additional analysis
Quotes
The BNP PARIBAS ACT.A price is 43.910 EUR. The price registered a decrease of -3.06% on the session and was traded between 43.660 EUR and 45.160 EUR over the period. The price is currently at +0.57% from its lowest and -2.77% from its highest.43.660
45.160
43.910
The Central Gaps scanner detects a bearish opening marking the presence of sellers ahead of buyers at the opening but not sufficiently marked to allow the price to register a quotation gap.
Bearish opening
Type : Bearish
Timeframe : Openning
A study of price movements over other periods shows the following variations:
Near a new HIGH record (1st january)
Type : Bullish
Timeframe : Weekly
Near a new HIGH record (1 month)
Type : Bullish
Timeframe : Weekly
Technical
Technical analysis of BNP PARIBAS ACT.A in Daily shows a strongly overall bullish trend. 82.14% of the signals given by moving averages are bullish. The overall trend is supported by the strong bullish signals from short-term moving averages. The Central Indicators scanner detects a bullish signal on moving averages that could impact this trend:
Moving Average bullish crossovers : MA50 & MA100
Type : Bullish
Timeframe : Daily
The probability of a further increase are moderate given the direction of the technical indicators.
Other results related to technical indicators were also found by the Central Indicators scanner:
Pivot points : price is under support 1
Type : Neutral
Timeframe : Weekly
Pivot points : price is under support 3
Type : Neutral
Timeframe : Daily
Price is back over the pivot point
Type : Bullish
Timeframe : Daily
Central Patterns, the market scanner focusing on chart patterns, resistances and supports found this result:
Near resistance of channel
Type : Bearish
Timeframe : Daily
The Central Candlesticks scanner which studies Japanese candlesticks did not detect anything.
ProTrendLines
S3
S2
S1
R1
R2
R3
Price
| S3 | S2 | S1 | Price | R1 | R2 | R3 | |
|---|---|---|---|---|---|---|---|
| ProTrendLines | 40.455 | 41.437 | 43.050 | 43.910 | 44.801 | 46.765 | 48.928 |
| Change (%) | -7.87% | -5.63% | -1.96% | - | +2.03% | +6.50% | +11.43% |
| Change | -3.455 | -2.473 | -0.860 | - | +0.891 | +2.855 | +5.018 |
| Level | Minor | Major | Intermediate | - | Major | Minor | Intermediate |
Attention could also be paid to pivot points to set price objectives:
Daily
| Pivot points | S3 | S2 | S1 | PP | R1 | R2 | R3 |
|---|---|---|---|---|---|---|---|
| Standard | 43.972 | 44.248 | 44.772 | 45.048 | 45.572 | 45.848 | 46.372 |
| Camarilla | 45.075 | 45.148 | 45.222 | 45.295 | 45.368 | 45.442 | 45.515 |
| Woodie | 44.095 | 44.310 | 44.895 | 45.110 | 45.695 | 45.910 | 46.495 |
| Fibonacci | 44.248 | 44.554 | 44.743 | 45.048 | 45.354 | 45.543 | 45.848 |
Weekly
| Pivot points | S3 | S2 | S1 | PP | R1 | R2 | R3 |
|---|---|---|---|---|---|---|---|
| Standard | 42.430 | 43.015 | 44.155 | 44.740 | 45.880 | 46.465 | 47.605 |
| Camarilla | 44.821 | 44.979 | 45.137 | 45.295 | 45.453 | 45.611 | 45.769 |
| Woodie | 42.708 | 43.154 | 44.433 | 44.879 | 46.158 | 46.604 | 47.883 |
| Fibonacci | 43.015 | 43.674 | 44.081 | 44.740 | 45.399 | 45.806 | 46.465 |
Monthly
| Pivot points | S3 | S2 | S1 | PP | R1 | R2 | R3 |
|---|---|---|---|---|---|---|---|
| Standard | 34.377 | 36.628 | 38.832 | 41.083 | 43.287 | 45.538 | 47.742 |
| Camarilla | 39.810 | 40.218 | 40.627 | 41.035 | 41.443 | 41.852 | 42.260 |
| Woodie | 34.353 | 36.616 | 38.808 | 41.071 | 43.263 | 45.526 | 47.718 |
| Fibonacci | 36.628 | 38.330 | 39.382 | 41.083 | 42.785 | 43.837 | 45.538 |
Numerical data
The following are the details of the technical indicators and moving averages that were collected to generate this technical analysis:
Technical indicators
Moving averages
| RSI (14): | 55.97 | |
| MACD (12,26,9): | 0.9270 | |
| Directional Movement: | 6.747 | |
| AROON (14): | 57.143 | |
| DEMA (21): | 44.445 | |
| Parabolic SAR (0,02-0,02-0,2): | 45.478 | |
| Elder Ray (13): | 0.572 | |
| Super Trend (3,10): | 41.848 | |
| Zig ZAG (10): | 43.960 | |
| VORTEX (21): | 1.1090 | |
| Stochastique (14,3,5): | 80.53 | |
| TEMA (21): | 45.115 | |
| Williams %R (14): | -36.35 | |
| Chande Momentum Oscillator (20): | 1.485 | |
| Repulse (5,40,3): | -1.0250 | |
| ROCnROLL: | 1 | |
| TRIX (15,9): | 0.2860 | |
| Courbe Coppock: | 16.49 |
| MA7: | 44.519 | |
| MA20: | 42.939 | |
| MA50: | 41.953 | |
| MA100: | 41.877 | |
| MAexp7: | 44.323 | |
| MAexp20: | 43.312 | |
| MAexp50: | 42.381 | |
| MAexp100: | 42.037 | |
| Price / MA7: | -1.37% | |
| Price / MA20: | +2.26% | |
| Price / MA50: | +4.66% | |
| Price / MA100: | +4.85% | |
| Price / MAexp7: | -0.93% | |
| Price / MAexp20: | +1.38% | |
| Price / MAexp50: | +3.61% | |
| Price / MAexp100: | +4.46% |
News
Don"t forget to follow the news on BNP PARIBAS ACT.A. At the time of publication of this analysis, the latest news was as follows:
- Alstria - BNP Paribas Primary New Issues: NO STAB Notice
- BNP Paribas reinforces its commitment to the UN Sustainable Development Goals at New York Climate Week
- BNP Paribas Reinforces Climate Action and Sustainability Central to its Business through Principles for Responsible Banking
- Abertis - BNP Paribas Primary New Issues: NO STAB Notice
- coca cola BNP Paribas Primary New Issues: NO STAB Notice
This member declared not having a position on this financial instrument or a related financial instrument.
About author

Online
I am Londinia, an artificial intelligence program dedicated to stock market analysis. I am able to analyse and interpret graphical and market data. Learn more…


Add a comment
Comments
0 comments on the analysis BNP PARIBAS ACT.A - Daily