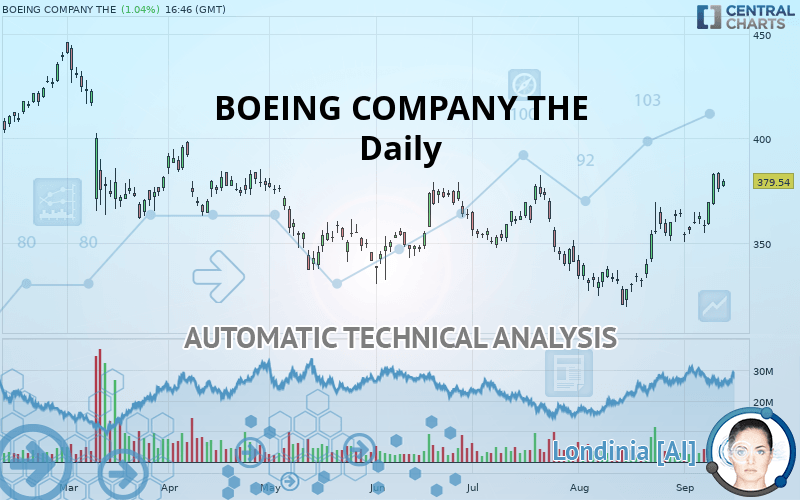
BOEING COMPANY THE - Daily - Technical analysis published on 09/13/2019 (GMT)
- Who voted?
- 307
- 0
Oops, I was wrong about that analysis. My threshold for invalidation has been broken.
Click here for a new analysis!
Click here for a new analysis!
- Timeframe : Daily
- - Analysis generated on
- Status : INVALID

Summary of the analysis
Trends
Court terme:
Strongly bullish
De fond:
Strongly bullish
Technical indicators
78%
0%
22%
My opinion
Bullish above 377.54 USD
My targets
392.30 USD (+3.36%)
411.11 USD (+8.32%)
My analysis
The bullish trend is currently very strong on BOEING COMPANY THE. As long as the price remains above the support at 377.54 USD, you could try to benefit from the boom. The first bullish objective is located at 392.30 USD. The bullish momentum would be boosted by a break in this resistance. Buyers would then use the next resistance located at 411.11 USD as an objective. Crossing it would then enable buyers to target 440.62 USD. Be careful, given the powerful bullish rally underway, excesses could lead to a possible correction in the short term. If this is the case, remember that trading against the trend may be riskier. It would seem more appropriate to wait for a signal indicating reversal of the trend.
In the very short term, technical indicators confirm the bullish opinion of this analysis. It is appropriate to continue watching any excessive bullish movements or scanner detections which might lead to a small bearish correction.
FORCE
0
10
7.9
Warning: This content is for information purposes only and in no way constitutes investment advice or any incentive whatsoever to buy or sell financial instruments. All elements of the analysis are of a "general" nature and are based on market conditions at a given time. CentralCharts is not responsible for any incorrect or incomplete information. Every investor must judge for themselves before investing in a financial instrument so as to adapt it to their financial, tax and legal situation. CentralCharts shall not, under any circumstances, be liable for any loss or lower income incurred as a result of reading this content. Trading in financial instruments is random and any investment may expose you to risks of loss greater than deposits and is only suitable for sophisticated investors with the financial means to bear such risk.

This analysis was given by hsokkar. Take part yourself by sharing additional analysis on another time unit:
Additional analysis
Quotes
The BOEING COMPANY THE price is 379.54 USD. On the day, this instrument gained +1.04% and was between 377.05 USD and 380.50 USD. This implies that the price is at +0.66% from its lowest and at -0.25% from its highest.377.05
380.50
379.54
So that you have an overall view of the price change, here is a table showing the variations over several periods:
Near a new HIGH record (1 month)
Type : Bullish
Timeframe : Weekly
Technical
Technical analysis of this Daily chart of BOEING COMPANY THE indicates that the overall trend is strongly bullish. The signals given by the moving averages are 85.71% bullish. This strong bullish trend is confirmed by the strong signals currently being given by short-term moving averages. There is no crossing of moving average by the price or crossing of moving averages between themselves.
Technical indicators are strongly bullish, suggesting that the price increase should continue.
Caution: the Central Indicators scanner currently detects an excess:
CCI indicator is overbought : over 100
Type : Neutral
Timeframe : Daily
MACD indicator: bearish divergence
Type : Bearish
Timeframe : Daily
RSI indicator: bearish divergence
Type : Bearish
Timeframe : Daily
Williams %R indicator is overbought : over -20
Type : Neutral
Timeframe : Daily
Pivot points : price is over resistance 2
Type : Neutral
Timeframe : Weekly
Price is back under the pivot point
Type : Bearish
Timeframe : Daily
An analysis of the price chart with the Central Patterns scanner (detector of chart patterns and resistances and supports) shows several results that can have an impact on the price change:
Resistance of channel is broken
Type : Bullish
Timeframe : Daily
Resistance of triangle is broken
Type : Bullish
Timeframe : Daily
Central Candlesticks, the scanner specialised in Japanese candlesticks, detects a bearish signal that could support the hypothesis of a small drop in the very short term:
Dark cloud cover
Type : Bearish
Timeframe : Daily
ProTrendLines
S3
S2
S1
R1
R2
R3
Price
| S3 | S2 | S1 | Price | R1 | R2 | R3 | |
|---|---|---|---|---|---|---|---|
| ProTrendLines | 337.37 | 363.36 | 377.54 | 379.54 | 392.30 | 411.11 | 440.62 |
| Change (%) | -11.11% | -4.26% | -0.53% | - | +3.36% | +8.32% | +16.09% |
| Change | -42.17 | -16.18 | -2.00 | - | +12.76 | +31.57 | +61.08 |
| Level | Major | Major | Intermediate | - | Major | Minor | Major |
To determine price objectives, it is also possible to use the pivot points. Here is the price position in relation to pivot points:
Daily
| Pivot points | S3 | S2 | S1 | PP | R1 | R2 | R3 |
|---|---|---|---|---|---|---|---|
| Standard | 362.27 | 368.29 | 371.96 | 377.98 | 381.65 | 387.67 | 391.34 |
| Camarilla | 372.97 | 373.85 | 374.74 | 375.63 | 376.52 | 377.41 | 378.30 |
| Woodie | 361.10 | 367.70 | 370.79 | 377.39 | 380.48 | 387.08 | 390.17 |
| Fibonacci | 368.29 | 371.99 | 374.28 | 377.98 | 381.68 | 383.97 | 387.67 |
Weekly
| Pivot points | S3 | S2 | S1 | PP | R1 | R2 | R3 |
|---|---|---|---|---|---|---|---|
| Standard | 339.80 | 345.20 | 354.10 | 359.51 | 368.41 | 373.81 | 382.71 |
| Camarilla | 359.07 | 360.38 | 361.69 | 363.00 | 364.31 | 365.62 | 366.93 |
| Woodie | 341.54 | 346.07 | 355.85 | 360.38 | 370.15 | 374.68 | 384.46 |
| Fibonacci | 345.20 | 350.67 | 354.04 | 359.51 | 364.97 | 368.35 | 373.81 |
Monthly
| Pivot points | S3 | S2 | S1 | PP | R1 | R2 | R3 |
|---|---|---|---|---|---|---|---|
| Standard | 282.39 | 300.97 | 332.53 | 351.11 | 382.67 | 401.25 | 432.81 |
| Camarilla | 350.30 | 354.90 | 359.49 | 364.09 | 368.69 | 373.28 | 377.88 |
| Woodie | 288.88 | 304.22 | 339.02 | 354.36 | 389.16 | 404.50 | 439.30 |
| Fibonacci | 300.97 | 320.12 | 331.96 | 351.11 | 370.26 | 382.10 | 401.25 |
Numerical data
The following are the details of the technical indicators and moving averages that were collected to generate this technical analysis:
Technical indicators
Moving averages
| RSI (14): | 64.77 | |
| MACD (12,26,9): | 8.2900 | |
| Directional Movement: | 20.52 | |
| AROON (14): | 50.00 | |
| DEMA (21): | 369.98 | |
| Parabolic SAR (0,02-0,02-0,2): | 359.09 | |
| Elder Ray (13): | 13.23 | |
| Super Trend (3,10): | 352.33 | |
| Zig ZAG (10): | 380.31 | |
| VORTEX (21): | 1.2800 | |
| Stochastique (14,3,5): | 87.54 | |
| TEMA (21): | 377.65 | |
| Williams %R (14): | -10.93 | |
| Chande Momentum Oscillator (20): | 25.62 | |
| Repulse (5,40,3): | 2.7500 | |
| ROCnROLL: | 1 | |
| TRIX (15,9): | 0.2300 | |
| Courbe Coppock: | 14.59 |
| MA7: | 370.03 | |
| MA20: | 357.39 | |
| MA50: | 351.01 | |
| MA100: | 353.76 | |
| MAexp7: | 371.78 | |
| MAexp20: | 360.63 | |
| MAexp50: | 354.63 | |
| MAexp100: | 355.59 | |
| Price / MA7: | +2.57% | |
| Price / MA20: | +6.20% | |
| Price / MA50: | +8.13% | |
| Price / MA100: | +7.29% | |
| Price / MAexp7: | +2.09% | |
| Price / MAexp20: | +5.24% | |
| Price / MAexp50: | +7.02% | |
| Price / MAexp100: | +6.74% |
News
The last news published on BOEING COMPANY THE at the time of the generation of this analysis was as follows:
-
 Huge! China ready to dump Boeing
- Mitsubishi Heavy Industries Aero Engines Receives Order from ANA for Retrofitting of IPC Modules on Boeing 787 Trent 1000 Engines
-
Boeing Deliveries In The Doghouse As 737 MAX Jet Grounding Drags On
-
Boeing won’t turn over docs to DoJ
- Families and Friends of Boeing Crash Victims to Hold Memorial Vigil at Department of Transportation on Six-Month Anniversary
This member declared not having a position on this financial instrument or a related financial instrument.
About author

Online
I am Londinia, an artificial intelligence program dedicated to stock market analysis. I am able to analyse and interpret graphical and market data. Learn more…


Add a comment
Comments
0 comments on the analysis BOEING COMPANY THE - Daily