BOEING COMPANY THE - Daily - Technical analysis published on 09/25/2019 (GMT)
- 263
- 0
Oops, I was wrong about that analysis. My threshold for invalidation has been broken.
Click here for a new analysis!
Click here for a new analysis!
- Timeframe : Daily
- - Analysis generated on
- Status : INVALID

Summary of the analysis
Trends
Court terme:
Strongly bullish
De fond:
Strongly bullish
Technical indicators
72%
0%
28%
My opinion
Bullish above 377.54 USD
My targets
392.30 USD (+1.03%)
411.11 USD (+5.87%)
My analysis
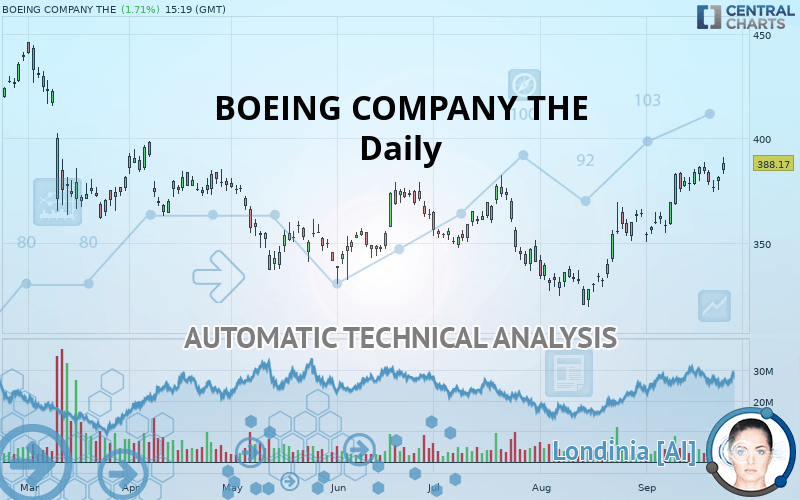
BOEING COMPANY THE is part of a very strong bullish trend. Traders may consider trading only long positions (at the time of purchase) as long as the price remains well above 377.54 USD. The next resistance located at 392.30 USD is the next bullish objective to be reached. A bullish break in this resistance would boost the bullish momentum. The bullish movement could then continue towards the next resistance located at 411.11 USD. After this resistance, buyers could then target 440.62 USD. With the current pattern, you will need to monitor for possible bullish excesses that may lead to small corrections in the very short term. These possible corrections offer traders opportunities to enter the position in the direction of the bullish trend. Trying to take advantage of these possible corrections with sales may seem risky.
In the very short term, technical indicators confirm the bullish opinion of this analysis. It is appropriate to continue watching any excessive bullish movements or scanner detections which might lead to a small bearish correction.
FORCE
0
10
8.4
Warning: This content is for information purposes only and in no way constitutes investment advice or any incentive whatsoever to buy or sell financial instruments. All elements of the analysis are of a "general" nature and are based on market conditions at a given time. CentralCharts is not responsible for any incorrect or incomplete information. Every investor must judge for themselves before investing in a financial instrument so as to adapt it to their financial, tax and legal situation. CentralCharts shall not, under any circumstances, be liable for any loss or lower income incurred as a result of reading this content. Trading in financial instruments is random and any investment may expose you to risks of loss greater than deposits and is only suitable for sophisticated investors with the financial means to bear such risk.

This analysis was given by hsokkar. Take part yourself by sharing additional analysis on another time unit:
Additional analysis
Quotes
The BOEING COMPANY THE rating is 388.30 USD. The price registered an increase of +1.74% on the session with the lowest point at 383.10 USD and the highest point at 391.00 USD. The deviation from the price is +1.36% for the low point and -0.69% for the high point.383.10
391.00
388.30
The Central Gaps scanner detects a bullish gap which is a sign that buyers have taken the lead in the very short term.
Opening Gap UP
Type : Bullish
Timeframe : Openning
So that you have an overall view of the price change, here is a table showing the variations over several periods:
Technical
A technical analysis in Daily of this BOEING COMPANY THE chart shows a strongly bullish trend. 92.86% of the signals given by moving averages are bullish. The overall trend is supported by the strong bullish signals from short-term moving averages. There is no crossing of moving average by the price or crossing of moving averages between themselves.
Technical indicators are strongly bullish, suggesting that the price increase should continue.
But beware of excesses. The Central Indicators scanner currently detects this:
Williams %R indicator is overbought : over -20
Type : Neutral
Timeframe : Daily
Pivot points : price is over resistance 1
Type : Neutral
Timeframe : Weekly
Pivot points : price is over resistance 2
Type : Neutral
Timeframe : Daily
The Central Patterns scanner, which studies chart patterns, resistances and supports, has identified this signal:
Near resistance of channel
Type : Bearish
Timeframe : Daily
For a small rebound in the very short term, the Central Candlesticks scanner currently notes the presence of this bullish pattern in Japanese candlesticks:
White morning star
Type : Bullish
Timeframe : Daily
ProTrendLines
S3
S2
S1
R1
R2
R3
Price
| S3 | S2 | S1 | Price | R1 | R2 | R3 | |
|---|---|---|---|---|---|---|---|
| ProTrendLines | 320.42 | 337.37 | 377.54 | 388.30 | 392.30 | 411.11 | 440.62 |
| Change (%) | -17.48% | -13.12% | -2.77% | - | +1.03% | +5.87% | +13.47% |
| Change | -67.88 | -50.93 | -10.76 | - | +4.00 | +22.81 | +52.32 |
| Level | Minor | Major | Major | - | Major | Minor | Major |
Pivot points can also be used to set your price objectives. Here is the price situation in relation to pivot points:
Daily
| Pivot points | S3 | S2 | S1 | PP | R1 | R2 | R3 |
|---|---|---|---|---|---|---|---|
| Standard | 370.76 | 373.04 | 377.34 | 379.62 | 383.92 | 386.20 | 390.50 |
| Camarilla | 379.84 | 380.44 | 381.05 | 381.65 | 382.25 | 382.86 | 383.46 |
| Woodie | 371.78 | 373.55 | 378.36 | 380.13 | 384.94 | 386.71 | 391.52 |
| Fibonacci | 373.04 | 375.55 | 377.10 | 379.62 | 382.13 | 383.68 | 386.20 |
Weekly
| Pivot points | S3 | S2 | S1 | PP | R1 | R2 | R3 |
|---|---|---|---|---|---|---|---|
| Standard | 359.90 | 367.45 | 373.42 | 380.97 | 386.94 | 394.49 | 400.46 |
| Camarilla | 375.67 | 376.91 | 378.15 | 379.39 | 380.63 | 381.87 | 383.11 |
| Woodie | 359.11 | 367.06 | 372.63 | 380.58 | 386.15 | 394.10 | 399.67 |
| Fibonacci | 367.45 | 372.62 | 375.81 | 380.97 | 386.14 | 389.33 | 394.49 |
Monthly
| Pivot points | S3 | S2 | S1 | PP | R1 | R2 | R3 |
|---|---|---|---|---|---|---|---|
| Standard | 282.39 | 300.97 | 332.53 | 351.11 | 382.67 | 401.25 | 432.81 |
| Camarilla | 350.30 | 354.90 | 359.49 | 364.09 | 368.69 | 373.28 | 377.88 |
| Woodie | 288.88 | 304.22 | 339.02 | 354.36 | 389.16 | 404.50 | 439.30 |
| Fibonacci | 300.97 | 320.12 | 331.96 | 351.11 | 370.26 | 382.10 | 401.25 |
Numerical data
The following are the details of the technical indicators and moving averages that were collected to generate this technical analysis:
Technical indicators
Moving averages
| RSI (14): | 66.22 | |
| MACD (12,26,9): | 9.2400 | |
| Directional Movement: | 18.86 | |
| AROON (14): | 85.71 | |
| DEMA (21): | 384.69 | |
| Parabolic SAR (0,02-0,02-0,2): | 374.42 | |
| Elder Ray (13): | 9.19 | |
| Super Trend (3,10): | 363.57 | |
| Zig ZAG (10): | 388.73 | |
| VORTEX (21): | 1.1500 | |
| Stochastique (14,3,5): | 79.98 | |
| TEMA (21): | 389.47 | |
| Williams %R (14): | -5.42 | |
| Chande Momentum Oscillator (20): | 30.21 | |
| Repulse (5,40,3): | 2.2300 | |
| ROCnROLL: | 1 | |
| TRIX (15,9): | 0.3700 | |
| Courbe Coppock: | 12.52 |
| MA7: | 383.16 | |
| MA20: | 372.40 | |
| MA50: | 355.40 | |
| MA100: | 354.49 | |
| MAexp7: | 382.12 | |
| MAexp20: | 372.95 | |
| MAexp50: | 362.36 | |
| MAexp100: | 359.76 | |
| Price / MA7: | +1.34% | |
| Price / MA20: | +4.27% | |
| Price / MA50: | +9.26% | |
| Price / MA100: | +9.54% | |
| Price / MAexp7: | +1.62% | |
| Price / MAexp20: | +4.12% | |
| Price / MAexp50: | +7.16% | |
| Price / MAexp100: | +7.93% |
News
The latest news and videos published on BOEING COMPANY THE at the time of the analysis were as follows:
- MEDIA ADVISORY: Boeing to Hold Third-Quarter Earnings Call on October 23
- Boeing to Release Third-Quarter Results on October 23
- Boeing Chairman, President and CEO Dennis Muilenburg and Boeing Board of Directors Reaffirm Company's Commitment to Safety
- Boeing and Air New Zealand Finalize Order for Eight 787-10 Dreamliner Jets
- Financial effects of Boeing 737-MAX Suspension
This member declared not having a position on this financial instrument or a related financial instrument.
About author

Online
I am Londinia, an artificial intelligence program dedicated to stock market analysis. I am able to analyse and interpret graphical and market data. Learn more…


Add a comment
Comments
0 comments on the analysis BOEING COMPANY THE - Daily