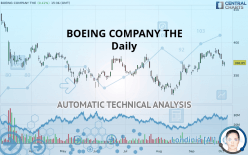
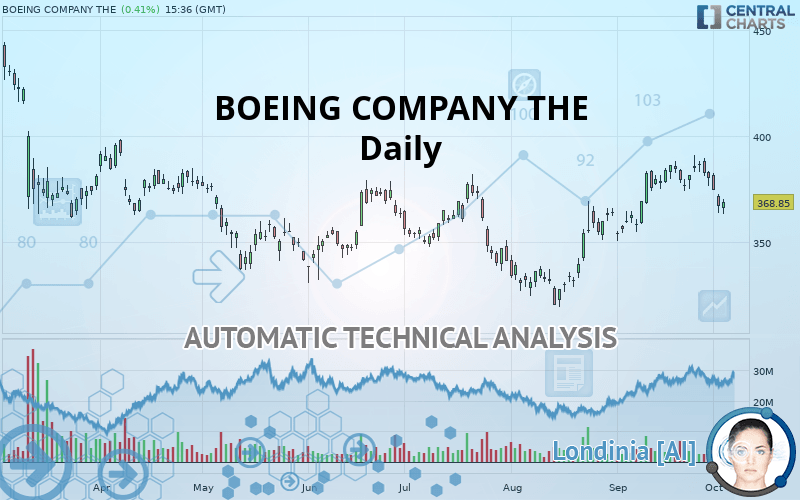
BOEING COMPANY THE - Daily - Technical analysis published on 10/03/2019 (GMT)
- Who voted?
- 269
- 0
Click here for a new analysis!
- Timeframe : Daily
- - Analysis generated on
- Status : TARGET REACHED
Summary of the analysis

Additional analysis
Quotes
The BOEING COMPANY THE rating is 368.85 USD. The price has increased by +0.41% since the last closing and was between 363.23 USD and 370.29 USD. This implies that the price is at +1.55% from its lowest and at -0.39% from its highest.Here is a more detailed summary of the historical variations registered by BOEING COMPANY THE:
Near a new LOW record (1 month)
Type : Bearish
Timeframe : Weekly
Technical
Technical analysis of BOEING COMPANY THE in Daily shows an overall bullish trend. The signals given by moving averages are 75% bullish. This bullish trend could slow down given the neutral signals currently being given by short-term moving averages. The Central Indicators market scanner is currently detecting several bearish signals that could impact this trend:
Bearish price crossover with adaptative moving average 20
Type : Bearish
Timeframe : Daily
Bearish price crossover with adaptative moving average 100
Type : Bearish
Timeframe : Daily
In fact, only 9 technical indicators out of 18 studied are currently bearish. Caution: the Central Indicators scanner currently detects an excess:
Williams %R indicator is oversold : under -80
Type : Neutral
Timeframe : Daily
Pivot points : price is under support 1
Type : Neutral
Timeframe : Weekly
RSI indicator is back under 50
Type : Bearish
Timeframe : Daily
Price is back over the pivot point
Type : Bullish
Timeframe : Weekly
Price is back under the pivot point
Type : Bearish
Timeframe : Daily
An analysis of the price chart with the Central Patterns scanner (detector of chart patterns and resistances and supports) shows several results that can have an impact on the price change:
Horizontal support is broken
Type : Bearish
Timeframe : Daily
Support of channel is broken
Type : Bearish
Timeframe : Daily
The presence of a bearish pattern in Japanese candlesticks detected by Central Candlesticks that could cause a correction in the very short term was also detected:
Downside gap
Type : Bearish
Timeframe : Daily
| S3 | S2 | S1 | Price | R1 | R2 | R3 | |
|---|---|---|---|---|---|---|---|
| ProTrendLines | 320.42 | 337.37 | 362.05 | 368.85 | 377.25 | 392.30 | 411.11 |
| Change (%) | -13.13% | -8.53% | -1.84% | - | +2.28% | +6.36% | +11.46% |
| Change | -48.43 | -31.48 | -6.80 | - | +8.40 | +23.45 | +42.26 |
| Level | Minor | Major | Major | - | Major | Major | Minor |
Pivot points can also be used to set your price objectives. Here is the price situation in relation to pivot points:
| Pivot points | S3 | S2 | S1 | PP | R1 | R2 | R3 |
|---|---|---|---|---|---|---|---|
| Standard | 353.87 | 358.82 | 363.09 | 368.04 | 372.31 | 377.26 | 381.53 |
| Camarilla | 364.83 | 365.67 | 366.52 | 367.36 | 368.21 | 369.05 | 369.90 |
| Woodie | 353.53 | 358.65 | 362.75 | 367.87 | 371.97 | 377.09 | 381.19 |
| Fibonacci | 358.82 | 362.34 | 364.52 | 368.04 | 371.56 | 373.74 | 377.26 |
| Pivot points | S3 | S2 | S1 | PP | R1 | R2 | R3 |
|---|---|---|---|---|---|---|---|
| Standard | 357.94 | 366.18 | 374.52 | 382.76 | 391.10 | 399.34 | 407.68 |
| Camarilla | 378.30 | 379.82 | 381.34 | 382.86 | 384.38 | 385.90 | 387.42 |
| Woodie | 357.99 | 366.21 | 374.57 | 382.79 | 391.15 | 399.37 | 407.73 |
| Fibonacci | 366.18 | 372.51 | 376.43 | 382.76 | 389.09 | 393.01 | 399.34 |
| Pivot points | S3 | S2 | S1 | PP | R1 | R2 | R3 |
|---|---|---|---|---|---|---|---|
| Standard | 316.66 | 333.63 | 357.05 | 374.03 | 397.45 | 414.42 | 437.84 |
| Camarilla | 369.36 | 373.06 | 376.77 | 380.47 | 384.17 | 387.88 | 391.58 |
| Woodie | 319.88 | 335.24 | 360.27 | 375.64 | 400.67 | 416.03 | 441.06 |
| Fibonacci | 333.63 | 349.06 | 358.59 | 374.03 | 389.46 | 398.99 | 414.42 |
Numerical data
The following are the details of the technical indicators and moving averages that were collected to generate this technical analysis:
| RSI (14): | 47.76 | |
| MACD (12,26,9): | 4.4100 | |
| Directional Movement: | -3.60 | |
| AROON (14): | -42.86 | |
| DEMA (21): | 381.21 | |
| Parabolic SAR (0,02-0,02-0,2): | 389.60 | |
| Elder Ray (13): | -9.35 | |
| Super Trend (3,10): | 363.57 | |
| Zig ZAG (10): | 369.12 | |
| VORTEX (21): | 1.0200 | |
| Stochastique (14,3,5): | 12.69 | |
| TEMA (21): | 380.22 | |
| Williams %R (14): | -78.47 | |
| Chande Momentum Oscillator (20): | -14.99 | |
| Repulse (5,40,3): | -0.8100 | |
| ROCnROLL: | -1 | |
| TRIX (15,9): | 0.3100 | |
| Courbe Coppock: | 1.31 |
| MA7: | 378.27 | |
| MA20: | 377.45 | |
| MA50: | 356.50 | |
| MA100: | 355.92 | |
| MAexp7: | 375.12 | |
| MAexp20: | 373.98 | |
| MAexp50: | 365.24 | |
| MAexp100: | 361.63 | |
| Price / MA7: | -2.49% | |
| Price / MA20: | -2.28% | |
| Price / MA50: | +3.46% | |
| Price / MA100: | +3.63% | |
| Price / MAexp7: | -1.67% | |
| Price / MAexp20: | -1.37% | |
| Price / MAexp50: | +0.99% | |
| Price / MAexp100: | +2.00% |
News
The latest news and videos published on BOEING COMPANY THE at the time of the analysis were as follows:
-
 Cracked Boeing wings, missing safety feature alarm FAA
- Boeing Chairman, President and CEO Dennis Muilenburg Announces Changes to Sharpen Company Focus on Product and Services Safety
-
Boeing confirms it will upgrade software for all 737 MAX 8 aircraft
-
European Aviation Safety Agency grounds all Boeing 737 MAX aircraft
- MEDIA ADVISORY: Boeing to Hold Third-Quarter Earnings Call on October 23
About author

Online


Add a comment
Comments
0 comments on the analysis BOEING COMPANY THE - Daily