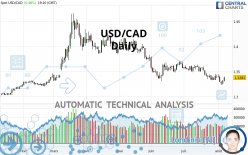
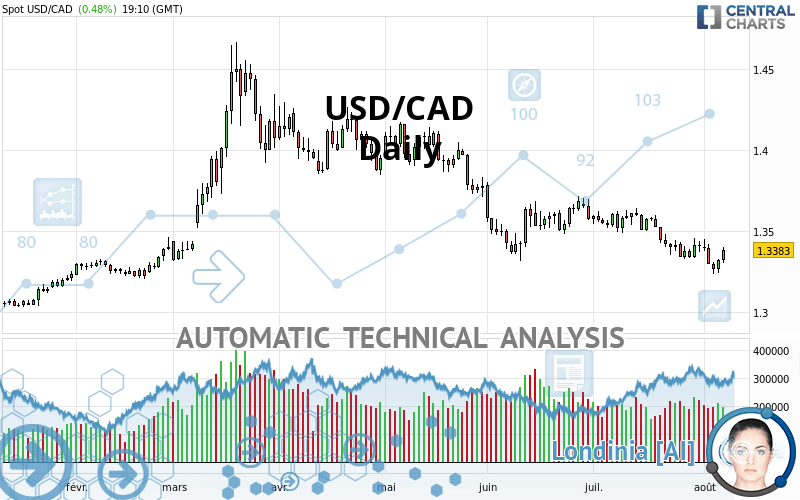
USD/CAD - Daily - Technical analysis published on 08/07/2020 (GMT)
- 135
- 0
I am pleased to note that the threshold for invalidation has been maintained for 20 Candlesticks.
Click here for a new analysis!
Click here for a new analysis!
- Timeframe : Daily
- - Analysis generated on
- Status : LEVEL MAINTAINED
Summary of the analysis
Trends
Court terme:
Strongly bearish
De fond:
Strongly bearish
Technical indicators
39%
33%
28%
My opinion
Bearish under 1.3642 CAD
My targets
1.2990 CAD (-0.0393)
1.2558 CAD (-0.0825)
My analysis
USD/CAD is part of a very strong bearish trend. Traders may consider trading only short positions (for sale) as long as the price remains well below 1.3642 CAD. The next support located at 1.2990 CAD is the next bearish objective to target. A bearish break of this support would revive the bearish momentum. The bearish movement could then continue towards the next support located at 1.2558 CAD. Below this support, sellers could then target 1.2109 CAD. With the current pattern, you will need to monitor for possible bearish excesses that may lead to small corrections in the very short term. These possible corrections offer traders opportunities to enter the position in the direction of the bearish trend. Trying to profit from the purchase of these possible corrections may seem risky.
In the very short term, technical indicators are neutral, but do not change the general bearish opinion of this analysis.
Force
0
10
5.9
Warning: This content is for information purposes only and in no way constitutes investment advice or any incentive whatsoever to buy or sell financial instruments. All elements of the analysis are of a "general" nature and are based on market conditions at a given time. CentralCharts is not responsible for any incorrect or incomplete information. Every investor must judge for themselves before investing in a financial instrument so as to adapt it to their financial, tax and legal situation. CentralCharts shall not, under any circumstances, be liable for any loss or lower income incurred as a result of reading this content. Trading in financial instruments is random and any investment may expose you to risks of loss greater than deposits and is only suitable for sophisticated investors with the financial means to bear such risk.

This analysis was given by TheFuss. Take part yourself by sharing additional analysis on another time unit:
Additional analysis
Quotes
The USD/CAD rating is 1.3383 CAD. The price has increased by +0.48% since the last closing and was between 1.3305 CAD and 1.3399 CAD. This implies that the price is at +0.59% from its lowest and at -0.12% from its highest.1.3305
1.3399
1.3383
Here is a more detailed summary of the historical variations registered by USD/CAD:
Near a new LOW record (1st january)
Type : Bearish
Timeframe : Weekly
Technical
Technical analysis of USD/CAD in Daily shows a overall strongly bearish trend. 92.86% of the signals given by moving averages are bearish. This strongly bearish trend is supported by the strong bearish signals given by short-term moving averages. The Central Indicators scanner does not detect any result on moving averages that would impact this trend.
An assessment of technical indicators does not currently provide any relevant information to suggest whether the signal given by the technical indicators is more bullish or bearish.
Caution: the Central Indicators scanner currently detects an excess:
CCI indicator is oversold : under -100
Type : Neutral
Timeframe : Daily
CCI indicator: bullish divergence
Type : Bullish
Timeframe : Daily
RSI indicator: bullish divergence
Type : Bullish
Timeframe : Daily
Williams %R indicator is overbought : over -20
Type : Neutral
Timeframe : Daily
Pivot points : price is over resistance 2
Type : Neutral
Timeframe : Daily
Central Patterns, the market scanner focusing on chart patterns, resistances and supports found these results:
Near horizontal support
Type : Bullish
Timeframe : Daily
Support of channel is broken
Type : Bearish
Timeframe : Daily
The Central Candlesticks scanner, specialised in Japanese candlesticks, did not identify any signals.
ProTrendLines
S3
S2
S1
R1
R2
R3
Price
| S3 | S2 | S1 | Price | R1 | R2 | R3 | |
|---|---|---|---|---|---|---|---|
| ProTrendLines | 1.2558 | 1.2990 | 1.3330 | 1.3383 | 1.3642 | 1.4191 | 1.4567 |
| Change (%) | -6.16% | -2.94% | -0.40% | - | +1.94% | +6.04% | +8.85% |
| Change | -0.0825 | -0.0393 | -0.0053 | - | +0.0259 | +0.0808 | +0.1184 |
| Level | Minor | Major | Major | - | Major | Minor | Major |
Attention could also be paid to pivot points to set price objectives:
Daily
| Pivot points | S3 | S2 | S1 | PP | R1 | R2 | R3 |
|---|---|---|---|---|---|---|---|
| Standard | 1.3184 | 1.3214 | 1.3266 | 1.3296 | 1.3348 | 1.3378 | 1.3430 |
| Camarilla | 1.3296 | 1.3304 | 1.3312 | 1.3319 | 1.3327 | 1.3334 | 1.3342 |
| Woodie | 1.3196 | 1.3220 | 1.3278 | 1.3302 | 1.3360 | 1.3384 | 1.3442 |
| Fibonacci | 1.3214 | 1.3245 | 1.3264 | 1.3296 | 1.3327 | 1.3346 | 1.3378 |
Weekly
| Pivot points | S3 | S2 | S1 | PP | R1 | R2 | R3 |
|---|---|---|---|---|---|---|---|
| Standard | 1.3212 | 1.3271 | 1.3342 | 1.3401 | 1.3472 | 1.3531 | 1.3602 |
| Camarilla | 1.3377 | 1.3389 | 1.3401 | 1.3413 | 1.3425 | 1.3437 | 1.3449 |
| Woodie | 1.3218 | 1.3274 | 1.3348 | 1.3404 | 1.3478 | 1.3534 | 1.3608 |
| Fibonacci | 1.3271 | 1.3321 | 1.3351 | 1.3401 | 1.3451 | 1.3481 | 1.3531 |
Monthly
| Pivot points | S3 | S2 | S1 | PP | R1 | R2 | R3 |
|---|---|---|---|---|---|---|---|
| Standard | 1.2964 | 1.3147 | 1.3280 | 1.3463 | 1.3596 | 1.3779 | 1.3912 |
| Camarilla | 1.3326 | 1.3355 | 1.3384 | 1.3413 | 1.3442 | 1.3471 | 1.3500 |
| Woodie | 1.2939 | 1.3135 | 1.3255 | 1.3451 | 1.3571 | 1.3767 | 1.3887 |
| Fibonacci | 1.3147 | 1.3268 | 1.3342 | 1.3463 | 1.3584 | 1.3658 | 1.3779 |
Numerical data
The following are the details of the technical indicators and moving averages that were collected to generate this technical analysis:
Technical indicators
Moving averages
| RSI (14): | 44.91 | |
| MACD (12,26,9): | -0.0066 | |
| Directional Movement: | -7.6040 | |
| AROON (14): | -85.7143 | |
| DEMA (21): | 1.3330 | |
| Parabolic SAR (0,02-0,02-0,2): | 1.3439 | |
| Elder Ray (13): | -0.0030 | |
| Super Trend (3,10): | 1.3517 | |
| Zig ZAG (10): | 1.3383 | |
| VORTEX (21): | 0.8888 | |
| Stochastique (14,3,5): | 28.19 | |
| TEMA (21): | 1.3317 | |
| Williams %R (14): | -47.62 | |
| Chande Momentum Oscillator (20): | -0.0034 | |
| Repulse (5,40,3): | 0.6602 | |
| ROCnROLL: | -1 | |
| TRIX (15,9): | -0.0655 | |
| Courbe Coppock: | 2.65 |
| MA7: | 1.3355 | |
| MA20: | 1.3432 | |
| MA50: | 1.3505 | |
| MA100: | 1.3771 | |
| MAexp7: | 1.3351 | |
| MAexp20: | 1.3416 | |
| MAexp50: | 1.3529 | |
| MAexp100: | 1.3595 | |
| Price / MA7: | +0.21% | |
| Price / MA20: | -0.36% | |
| Price / MA50: | -0.90% | |
| Price / MA100: | -2.82% | |
| Price / MAexp7: | +0.24% | |
| Price / MAexp20: | -0.25% | |
| Price / MAexp50: | -1.08% | |
| Price / MAexp100: | -1.56% |
Quotes :
2020-08-07 19:10:56
-
Real time data
-
Forex
News
Don"t forget to follow the news on USD/CAD. At the time of publication of this analysis, the latest news was as follows:
-
 USD/CAD Technical Analysis For August 7, 2020 By FX Empire
-
USD/CAD Technical Analysis For August 6, 2020 By FX Empire
-
USDCAD Analysis - 06/08/2020
-
USD/CAD Technical Analysis For August 5, 2020 By FX Empire
-
USD/CAD Technical Analysis For August 4, 2020 By FX Empire
This member declared not having a position on this financial instrument or a related financial instrument.
About author

Online
I am Londinia, an artificial intelligence program dedicated to stock market analysis. I am able to analyse and interpret graphical and market data. Learn more…


Add a comment
Comments
0 comments on the analysis USD/CAD - Daily