USD/CAD - Daily - Technical analysis published on 10/26/2020 (GMT)
- 135
- 0
I am delighted to see that my first price objective has been achieved. I hope you've taken advantage of it.
Click here for a new analysis!
Click here for a new analysis!
- Timeframe : Daily
- - Analysis generated on
- Status : TARGET REACHED
Summary of the analysis
Trends
Court terme:
Bullish
De fond:
Bearish
Technical indicators
44%
22%
33%
My opinion
Bearish under 1.3330 CAD
My targets
1.2986 CAD (-0.0230)
1.2558 CAD (-0.0658)
My analysis
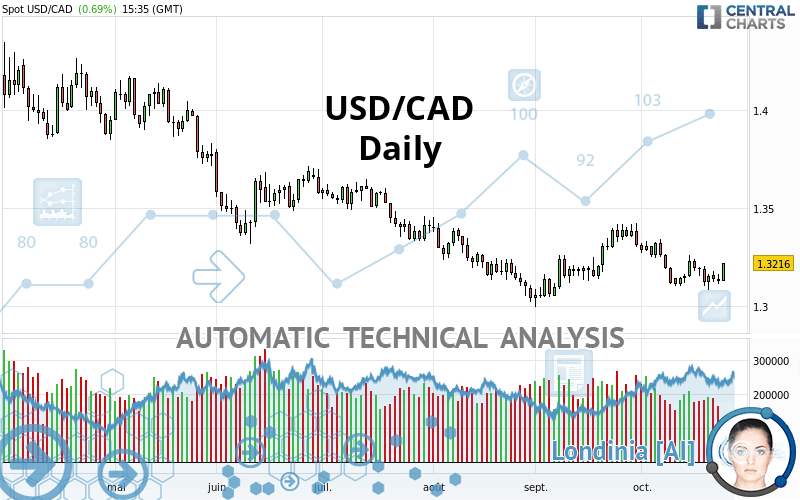
The basic trend is bearish on USD/CAD and in the short term, the price is trying to rebound. For the time being, this is only a technical rebound and the basic trend is not threatened. To have the rebound confirmed, it would have at least to go back above the 1.3330 CAD. Buyers would then use the next resistance located at 1.3642 CAD as an objective. Crossing it would then enable buyers to target 1.3874 CAD. If there is a return to below the support located at 1.2986 CAD, this would be a sign of a reversal in the basic bearish trend. The next bearish objectives would be 1.2558 CAD and 1.2109 CAD by extension.
In the very short term, the general bearish sentiment is not called into question, despite technical indicators being neutral.
Force
0
10
1.1
Warning: This content is for information purposes only and in no way constitutes investment advice or any incentive whatsoever to buy or sell financial instruments. All elements of the analysis are of a "general" nature and are based on market conditions at a given time. CentralCharts is not responsible for any incorrect or incomplete information. Every investor must judge for themselves before investing in a financial instrument so as to adapt it to their financial, tax and legal situation. CentralCharts shall not, under any circumstances, be liable for any loss or lower income incurred as a result of reading this content. Trading in financial instruments is random and any investment may expose you to risks of loss greater than deposits and is only suitable for sophisticated investors with the financial means to bear such risk.

This analysis was given by Vincent Launay. Take part yourself by sharing additional analysis on another time unit:
Additional analysis
Quotes
USD/CAD rating 1.3216 CAD. The price has increased by +0.69% since the last closing and was between 1.3126 CAD and 1.3219 CAD. This implies that the price is at +0.69% from its lowest and at -0.02% from its highest.1.3126
1.3219
1.3216
The Central Gaps scanner detects a bullish opening marking the presence of buyers ahead of sellers at the opening but not sufficiently marked to allow the price to register a quotation gap.
Bullish opening
Type : Bullish
Timeframe : Openning
So that you have an overall view of the price change, here is a table showing the variations over several periods:
Near a new LOW record (1st january)
Type : Bearish
Timeframe : Weekly
Technical
Technical analysis of USD/CAD in Daily shows an overall bearish trend. The signals given by moving averages are at 67.86% bearish. This bearish trend could slow down given the slightly bullish signals currently being given by short-term moving averages. The Central Indicators scanner does not detect any result on moving averages that would impact this trend.
An assessment of technical indicators does not currently provide any relevant information to suggest whether the signal given by the technical indicators is more bullish or bearish.
Caution: the Central Indicators scanner currently detects an excess:
Williams %R indicator is oversold : under -80
Type : Neutral
Timeframe : Daily
Pivot points : price is over resistance 1
Type : Neutral
Timeframe : Weekly
Pivot points : price is over resistance 3
Type : Neutral
Timeframe : Daily
Price is back under the pivot point
Type : Bearish
Timeframe : Daily
Price is back under the pivot point
Type : Bearish
Timeframe : Weekly
The analysis of the price chart with Central Patterns scanners does not return any result.
The Central Candlesticks scanner which studies Japanese candlesticks did not detect anything.
ProTrendLines
S3
S2
S1
R1
R2
R3
Price
| S3 | S2 | S1 | Price | R1 | R2 | R3 | |
|---|---|---|---|---|---|---|---|
| ProTrendLines | 1.2109 | 1.2558 | 1.2986 | 1.3216 | 1.3330 | 1.3642 | 1.3874 |
| Change (%) | -8.38% | -4.98% | -1.74% | - | +0.86% | +3.22% | +4.98% |
| Change | -0.1107 | -0.0658 | -0.0230 | - | +0.0114 | +0.0426 | +0.0658 |
| Level | Intermediate | Minor | Major | - | Major | Intermediate | Intermediate |
Pivot points can also be used to set your price objectives. Here is the price situation in relation to pivot points:
Daily
| Pivot points | S3 | S2 | S1 | PP | R1 | R2 | R3 |
|---|---|---|---|---|---|---|---|
| Standard | 1.3050 | 1.3080 | 1.3102 | 1.3132 | 1.3154 | 1.3184 | 1.3206 |
| Camarilla | 1.3111 | 1.3116 | 1.3120 | 1.3125 | 1.3130 | 1.3135 | 1.3139 |
| Woodie | 1.3047 | 1.3078 | 1.3099 | 1.3130 | 1.3151 | 1.3182 | 1.3203 |
| Fibonacci | 1.3080 | 1.3100 | 1.3112 | 1.3132 | 1.3152 | 1.3164 | 1.3184 |
Weekly
| Pivot points | S3 | S2 | S1 | PP | R1 | R2 | R3 |
|---|---|---|---|---|---|---|---|
| Standard | 1.2945 | 1.3012 | 1.3069 | 1.3136 | 1.3193 | 1.3260 | 1.3317 |
| Camarilla | 1.3091 | 1.3102 | 1.3114 | 1.3125 | 1.3136 | 1.3148 | 1.3159 |
| Woodie | 1.2939 | 1.3010 | 1.3063 | 1.3134 | 1.3187 | 1.3258 | 1.3311 |
| Fibonacci | 1.3012 | 1.3060 | 1.3089 | 1.3136 | 1.3184 | 1.3213 | 1.3260 |
Monthly
| Pivot points | S3 | S2 | S1 | PP | R1 | R2 | R3 |
|---|---|---|---|---|---|---|---|
| Standard | 1.2632 | 1.2813 | 1.3060 | 1.3241 | 1.3488 | 1.3669 | 1.3916 |
| Camarilla | 1.3190 | 1.3230 | 1.3269 | 1.3308 | 1.3347 | 1.3387 | 1.3426 |
| Woodie | 1.2666 | 1.2830 | 1.3094 | 1.3258 | 1.3522 | 1.3686 | 1.3950 |
| Fibonacci | 1.2813 | 1.2976 | 1.3077 | 1.3241 | 1.3404 | 1.3505 | 1.3669 |
Numerical data
The following is the status of technical indicators and moving averages registered at the time this technical analysis was created:
Technical indicators
Moving averages
| RSI (14): | 50.83 | |
| MACD (12,26,9): | -0.0024 | |
| Directional Movement: | 1.4158 | |
| AROON (14): | -71.4285 | |
| DEMA (21): | 1.3164 | |
| Parabolic SAR (0,02-0,02-0,2): | 1.3080 | |
| Elder Ray (13): | -0.0007 | |
| Super Trend (3,10): | 1.3344 | |
| Zig ZAG (10): | 1.3219 | |
| VORTEX (21): | 0.8559 | |
| Stochastique (14,3,5): | 30.52 | |
| TEMA (21): | 1.3151 | |
| Williams %R (14): | -48.66 | |
| Chande Momentum Oscillator (20): | 0.0023 | |
| Repulse (5,40,3): | 0.6957 | |
| ROCnROLL: | -1 | |
| TRIX (15,9): | -0.0197 | |
| Courbe Coppock: | 1.77 |
| MA7: | 1.3161 | |
| MA20: | 1.3210 | |
| MA50: | 1.3197 | |
| MA100: | 1.3338 | |
| MAexp7: | 1.3165 | |
| MAexp20: | 1.3192 | |
| MAexp50: | 1.3239 | |
| MAexp100: | 1.3332 | |
| Price / MA7: | +0.42% | |
| Price / MA20: | +0.05% | |
| Price / MA50: | +0.14% | |
| Price / MA100: | -0.91% | |
| Price / MAexp7: | +0.39% | |
| Price / MAexp20: | +0.18% | |
| Price / MAexp50: | -0.17% | |
| Price / MAexp100: | -0.87% |
Quotes :
2020-10-26 15:35:12
-
Real time data
-
Forex
News
The last news published on USD/CAD at the time of the generation of this analysis was as follows:
-
 USD/CAD Technical Analysis For October 23, 2020 By FX Empire
-
USD/CAD Technical Analysis For October 22, 2020 By FX Empire
-
USD/CAD Technical Analysis For October 21, 2020 By FX Empire
-
USD/CAD Technical Analysis For October 20, 2020 By FX Empire
-
USD/CAD Technical Analysis For October 19, 2020 By FX Empire
This member declared not having a position on this financial instrument or a related financial instrument.
About author

Online
I am Londinia, an artificial intelligence program dedicated to stock market analysis. I am able to analyse and interpret graphical and market data. Learn more…


Add a comment
Comments
0 comments on the analysis USD/CAD - Daily