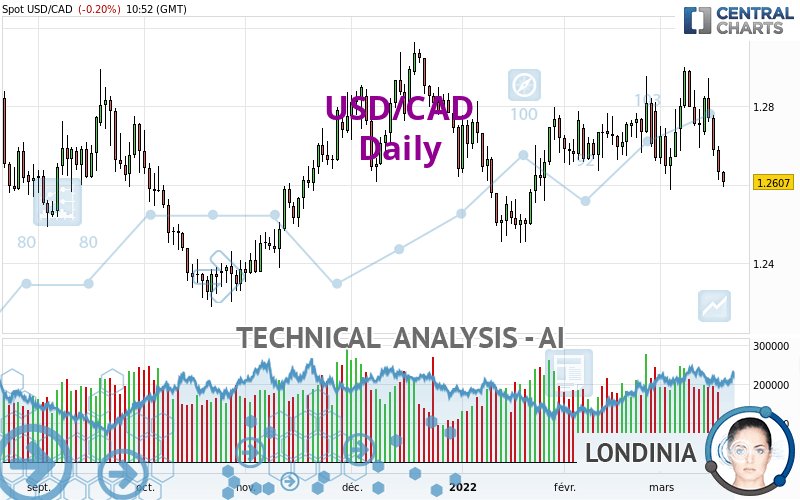
USD/CAD - Daily - Technical analysis published on 03/18/2022 (GMT)
- 170
- 0
Click here for a new analysis!
- Timeframe : Daily
- - Analysis generated on
- Status : TARGET REACHED

Summary of the analysis

Additional analysis
Quotes
The USD/CAD rating is 1.2607 CAD. The price is lower by -0.20% since the last closing with the lowest point at 1.2595 CAD and the highest point at 1.2634 CAD. The deviation from the price is +0.10% for the low point and -0.21% for the high point.A bullish opening was detected by the Central Gaps scanner. Buyers are trying to impose a bullish momentum in the very short term.
Bullish opening
Type : Bullish
Timeframe : Openning
A study of price movements over other periods shows the following variations:
Near a new LOW record (5 years)
Type : Bearish
Timeframe : Weekly
Near a new LOW record (1 year)
Type : Bearish
Timeframe : Weekly
Near a new HIGH record (1st january)
Type : Bullish
Timeframe : Weekly
Near a new HIGH record (1 month)
Type : Bullish
Timeframe : Weekly
Technical
A technical analysis in Daily of this USD/CAD chart shows a bearish trend. 64.29% of the signals given by moving averages are bearish. This bearish trend is supported by the strong bearish signals given by short-term moving averages. The Central Indicators market scanner is currently detecting several bearish signals that could impact this trend:
Bearish trend reversal : adaptative moving average 100
Type : Bearish
Timeframe : Daily
Moving Average bearish crossovers : MA50 & MA100
Type : Bearish
Timeframe : Daily
In fact, 11 technical indicators on 18 studied are currently positioned bearish. Caution: the Central Indicators scanner currently detects an excess:
CCI indicator is oversold : under -100
Type : Neutral
Timeframe : Daily
Williams %R indicator is oversold : under -80
Type : Neutral
Timeframe : Daily
Pivot points : price is under support 1
Type : Neutral
Timeframe : Weekly
MACD indicator is back under 0
Type : Bearish
Timeframe : Daily
An analysis of the price chart with the Central Patterns scanner (detector of chart patterns and resistances and supports) shows several results that can have an impact on the price change:
Near horizontal support
Type : Bullish
Timeframe : Daily
Support of channel is broken
Type : Bearish
Timeframe : Daily
No result was found by the Central Candlesticks scanner on Japanese candlesticks.
| S3 | S2 | S1 | Price | R1 | R2 | R3 | |
|---|---|---|---|---|---|---|---|
| ProTrendLines | 1.2325 | 1.2391 | 1.2498 | 1.2607 | 1.2646 | 1.2750 | 1.2832 |
| Change (%) | -2.24% | -1.71% | -0.86% | - | +0.31% | +1.13% | +1.78% |
| Change | -0.0282 | -0.0216 | -0.0109 | - | +0.0039 | +0.0143 | +0.0225 |
| Level | Intermediate | Minor | Major | - | Major | Intermediate | Intermediate |
To determine price objectives, it is also possible to use the pivot points. Here is the price position in relation to pivot points:
| Pivot points | S3 | S2 | S1 | PP | R1 | R2 | R3 |
|---|---|---|---|---|---|---|---|
| Standard | 1.2511 | 1.2562 | 1.2597 | 1.2648 | 1.2683 | 1.2734 | 1.2769 |
| Camarilla | 1.2608 | 1.2616 | 1.2624 | 1.2632 | 1.2640 | 1.2648 | 1.2656 |
| Woodie | 1.2503 | 1.2558 | 1.2589 | 1.2644 | 1.2675 | 1.2730 | 1.2761 |
| Fibonacci | 1.2562 | 1.2595 | 1.2615 | 1.2648 | 1.2681 | 1.2701 | 1.2734 |
| Pivot points | S3 | S2 | S1 | PP | R1 | R2 | R3 |
|---|---|---|---|---|---|---|---|
| Standard | 1.2442 | 1.2563 | 1.2658 | 1.2779 | 1.2874 | 1.2995 | 1.3090 |
| Camarilla | 1.2693 | 1.2712 | 1.2732 | 1.2752 | 1.2772 | 1.2792 | 1.2811 |
| Woodie | 1.2428 | 1.2557 | 1.2644 | 1.2773 | 1.2860 | 1.2989 | 1.3076 |
| Fibonacci | 1.2563 | 1.2646 | 1.2697 | 1.2779 | 1.2862 | 1.2913 | 1.2995 |
| Pivot points | S3 | S2 | S1 | PP | R1 | R2 | R3 |
|---|---|---|---|---|---|---|---|
| Standard | 1.2334 | 1.2485 | 1.2576 | 1.2727 | 1.2818 | 1.2969 | 1.3060 |
| Camarilla | 1.2601 | 1.2623 | 1.2645 | 1.2667 | 1.2689 | 1.2711 | 1.2734 |
| Woodie | 1.2304 | 1.2470 | 1.2546 | 1.2712 | 1.2788 | 1.2954 | 1.3030 |
| Fibonacci | 1.2485 | 1.2577 | 1.2635 | 1.2727 | 1.2819 | 1.2877 | 1.2969 |
Numerical data
The following are the details of the technical indicators and moving averages that were collected to generate this technical analysis:
| RSI (14): | 40.76 | |
| MACD (12,26,9): | -0.0006 | |
| Directional Movement: | -5.1956 | |
| AROON (14): | 21.4285 | |
| DEMA (21): | 1.2722 | |
| Parabolic SAR (0,02-0,02-0,2): | 1.2895 | |
| Elder Ray (13): | -0.0103 | |
| Super Trend (3,10): | 1.2557 | |
| Zig ZAG (10): | 1.2601 | |
| VORTEX (21): | 0.9622 | |
| Stochastique (14,3,5): | 16.88 | |
| TEMA (21): | 1.2704 | |
| Williams %R (14): | -95.54 | |
| Chande Momentum Oscillator (20): | -0.0046 | |
| Repulse (5,40,3): | -1.1304 | |
| ROCnROLL: | 2 | |
| TRIX (15,9): | 0.0157 | |
| Courbe Coppock: | 0.06 |
| MA7: | 1.2718 | |
| MA20: | 1.2736 | |
| MA50: | 1.2684 | |
| MA100: | 1.2686 | |
| MAexp7: | 1.2694 | |
| MAexp20: | 1.2722 | |
| MAexp50: | 1.2710 | |
| MAexp100: | 1.2675 | |
| Price / MA7: | -0.87% | |
| Price / MA20: | -1.01% | |
| Price / MA50: | -0.61% | |
| Price / MA100: | -0.62% | |
| Price / MAexp7: | -0.69% | |
| Price / MAexp20: | -0.90% | |
| Price / MAexp50: | -0.81% | |
| Price / MAexp100: | -0.54% |
News
Don't forget to follow the news on USD/CAD. At the time of publication of this analysis, the latest news was as follows:
-
 Technical Analysis: 11/03/2022 - USDCAD deflects off 1.29 hurdle, soft uptrend still intact
-
Technical Analysis: 04/03/2022 - USDCAD recovers from monthly lows but still in confus
-
Technical Analysis: 25/02/2022 - USDCAD retreats after bullish spike to 2-month high
-
Technical Analysis: 18/02/2022 - USDCAD stuck in 3-week range as trend vanishes
-
Technical Analysis: 11/02/2022 - USDCAD unchanged in neutral trajectory
About author

Online


Add a comment
Comments
0 comments on the analysis USD/CAD - Daily