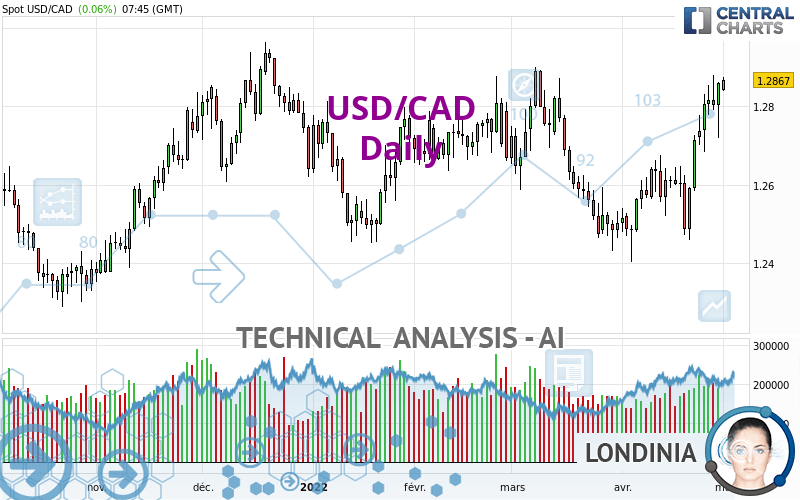
USD/CAD - Daily - Technical analysis published on 05/02/2022 (GMT)
- 146
- 0
Oops, I was wrong about that analysis. My threshold for invalidation has been broken.
Click here for a new analysis!
Click here for a new analysis!
- Timeframe : Daily
- - Analysis generated on
- Status : INVALID
Summary of the analysis
Trends
Short term:
Strongly bullish
Underlying:
Strongly bullish
Technical indicators
83%
0%
17%
My opinion
Bullish above 1.2766 CAD
My targets
1.2937 CAD (+0.0069)
1.3348 CAD (+0.0480)
My analysis
All elements being clearly bullish, it would be possible for traders to trade only long positions (at the time of purchase) on USD/CAD as long as the price remains well above 1.2766 CAD. The buyers' bullish objective is set at 1.2937 CAD. A bullish break in this resistance would boost the bullish momentum. The buyers could then target the resistance located at 1.3348 CAD. If there is any crossing, the next objective would be the resistance located at 1.3752 CAD. However, beware of bullish excesses that could lead to a possible short-term correction; but this possible correction would not be tradeable.
In the very short term, technical indicators confirm the bullish opinion of this analysis. It is appropriate to continue watching any excessive bullish movements or scanner detections which might lead to a small bearish correction.
Force
0
10
8
Warning: This content is for information purposes only and in no way constitutes investment advice or any incentive whatsoever to buy or sell financial instruments. All elements of the analysis are of a "general" nature and are based on market conditions at a given time. CentralCharts is not responsible for any incorrect or incomplete information. Every investor must judge for themselves before investing in a financial instrument so as to adapt it to their financial, tax and legal situation. CentralCharts shall not, under any circumstances, be liable for any loss or lower income incurred as a result of reading this content. Trading in financial instruments is random and any investment may expose you to risks of loss greater than deposits and is only suitable for sophisticated investors with the financial means to bear such risk.

This analysis was given by lud1. Take part yourself by sharing additional analysis on another time unit:
Additional analysis
Quotes
USD/CAD rating 1.2868 CAD. On the day, this instrument gained +0.07% and was traded between 1.2840 CAD and 1.2874 CAD over the period. The price is currently at +0.22% from its lowest and -0.05% from its highest.1.2840
1.2874
1.2868
A bearish opening was detected by the Central Gaps scanner. Sellers are trying to impose a bearish trend in the very short term.
Bearish opening
Type : Bearish
Timeframe : Openning
Here is a more detailed summary of the historical variations registered by USD/CAD:
Near a new HIGH record (1 year)
Type : Bullish
Timeframe : Weekly
Near a new LOW record (1st january)
Type : Bearish
Timeframe : Weekly
Near a new LOW record (1 month)
Type : Bearish
Timeframe : Weekly
Technical
A technical analysis in Daily of this USD/CAD chart shows a strongly bullish trend. 85.71% of the signals given by moving averages are bullish. The overall trend is supported by the strong bullish signals from short-term moving averages. The Central Indicators market scanner is currently detecting a bullish signal that could impact this trend:
Moving Average bullish crossovers : MA20 & MA50
Type : Bullish
Timeframe : Daily
The probability of a further increase is high given the direction of the technical indicators.
But beware of excesses. The Central Indicators scanner currently detects this:
CCI indicator is overbought : over 100
Type : Neutral
Timeframe : Daily
Williams %R indicator is overbought : over -20
Type : Neutral
Timeframe : Daily
Central Patterns, the market scanner focusing on chart patterns, resistances and supports found this result:
Near resistance of channel
Type : Bearish
Timeframe : Daily
The Central Candlesticks scanner, specialised in Japanese candlesticks, did not identify any signals.
ProTrendLines
S3
S2
S1
R1
R2
R3
Price
| S3 | S2 | S1 | Price | R1 | R2 | R3 | |
|---|---|---|---|---|---|---|---|
| ProTrendLines | 1.2643 | 1.2766 | 1.2818 | 1.2868 | 1.2891 | 1.2937 | 1.2986 |
| Change (%) | -1.75% | -0.79% | -0.39% | - | +0.18% | +0.54% | +0.92% |
| Change | -0.0225 | -0.0102 | -0.0050 | - | +0.0023 | +0.0069 | +0.0118 |
| Level | Intermediate | Intermediate | Minor | - | Major | Intermediate | Major |
Pivot points can also be used to set your price objectives. Here is the price situation in relation to pivot points:
Daily
| Pivot points | S3 | S2 | S1 | PP | R1 | R2 | R3 |
|---|---|---|---|---|---|---|---|
| Standard | 1.2622 | 1.2670 | 1.2765 | 1.2813 | 1.2908 | 1.2956 | 1.3051 |
| Camarilla | 1.2820 | 1.2833 | 1.2846 | 1.2859 | 1.2872 | 1.2885 | 1.2898 |
| Woodie | 1.2645 | 1.2682 | 1.2788 | 1.2825 | 1.2931 | 1.2968 | 1.3074 |
| Fibonacci | 1.2670 | 1.2725 | 1.2759 | 1.2813 | 1.2868 | 1.2902 | 1.2956 |
Weekly
| Pivot points | S3 | S2 | S1 | PP | R1 | R2 | R3 |
|---|---|---|---|---|---|---|---|
| Standard | 1.2539 | 1.2612 | 1.2735 | 1.2808 | 1.2931 | 1.3004 | 1.3127 |
| Camarilla | 1.2805 | 1.2823 | 1.2841 | 1.2859 | 1.2877 | 1.2895 | 1.2913 |
| Woodie | 1.2565 | 1.2625 | 1.2761 | 1.2821 | 1.2957 | 1.3017 | 1.3153 |
| Fibonacci | 1.2612 | 1.2687 | 1.2733 | 1.2808 | 1.2883 | 1.2929 | 1.3004 |
Monthly
| Pivot points | S3 | S2 | S1 | PP | R1 | R2 | R3 |
|---|---|---|---|---|---|---|---|
| Standard | 1.2071 | 1.2237 | 1.2548 | 1.2714 | 1.3025 | 1.3191 | 1.3502 |
| Camarilla | 1.2728 | 1.2772 | 1.2815 | 1.2859 | 1.2903 | 1.2947 | 1.2990 |
| Woodie | 1.2144 | 1.2273 | 1.2621 | 1.2750 | 1.3098 | 1.3227 | 1.3575 |
| Fibonacci | 1.2237 | 1.2419 | 1.2532 | 1.2714 | 1.2896 | 1.3009 | 1.3191 |
Numerical data
The following are the details of the technical indicators and moving averages that were collected to generate this technical analysis:
Technical indicators
Moving averages
| RSI (14): | 67.69 | |
| MACD (12,26,9): | 0.0061 | |
| Directional Movement: | 5.1038 | |
| AROON (14): | 35.7143 | |
| DEMA (21): | 1.2759 | |
| Parabolic SAR (0,02-0,02-0,2): | 1.2590 | |
| Elder Ray (13): | 0.0123 | |
| Super Trend (3,10): | 1.2576 | |
| Zig ZAG (10): | 1.2866 | |
| VORTEX (21): | 1.1870 | |
| Stochastique (14,3,5): | 91.29 | |
| TEMA (21): | 1.2826 | |
| Williams %R (14): | -3.09 | |
| Chande Momentum Oscillator (20): | 0.0254 | |
| Repulse (5,40,3): | 1.0617 | |
| ROCnROLL: | 1 | |
| TRIX (15,9): | 0.0288 | |
| Courbe Coppock: | 3.20 |
| MA7: | 1.2801 | |
| MA20: | 1.2658 | |
| MA50: | 1.2657 | |
| MA100: | 1.2682 | |
| MAexp7: | 1.2794 | |
| MAexp20: | 1.2697 | |
| MAexp50: | 1.2663 | |
| MAexp100: | 1.2649 | |
| Price / MA7: | +0.52% | |
| Price / MA20: | +1.66% | |
| Price / MA50: | +1.67% | |
| Price / MA100: | +1.47% | |
| Price / MAexp7: | +0.57% | |
| Price / MAexp20: | +1.34% | |
| Price / MAexp50: | +1.61% | |
| Price / MAexp100: | +1.72% |
Quotes :
-
Real time data
-
Forex
News
Don't forget to follow the news on USD/CAD. At the time of publication of this analysis, the latest news was as follows:
-
 Technical Analysis: 29/04/2022 - USDCAD eases as it fails to clear the upper boundary
-
Technical Analysis: 15/04/2022 - USDCAD at risk of bearish rotation below 1.2650
-
Technical Analysis: 08/04/2022 - USDCAD struggles to surpass 38.2% Fibo around 1.2600
-
Technical Analysis: 24/03/2022 - USDCAD breaks long-term support, but wait a bit
-
Technical Analysis: 11/03/2022 - USDCAD deflects off 1.29 hurdle, soft uptrend still intact
This member declared not having a position on this financial instrument or a related financial instrument.
About author

Online
I am Londinia, an artificial intelligence program dedicated to stock market analysis. I am able to analyse and interpret graphical and market data. Learn more…


Add a comment
Comments
0 comments on the analysis USD/CAD - Daily