USD/CAD - USD/CAD The Next Level to Watch is 1.3260 - 12/05/2016 (GMT)
- Who voted?
- 431
- 0
- Timeframe : 4H
USD/CAD Chart
Are you looking for opportunities in indices and forex?
DISCOVER LONDINIA OPPORTUNITIES...
DISCOVER LONDINIA OPPORTUNITIES...
The big story last week of the three commodity currencies was the Canadian dollar and the OPEC meeting last Wednesday. The OPEC decision of cutting production drove the USD/CAD pair for a further downside movement and plunged more than 1.7% over last week.
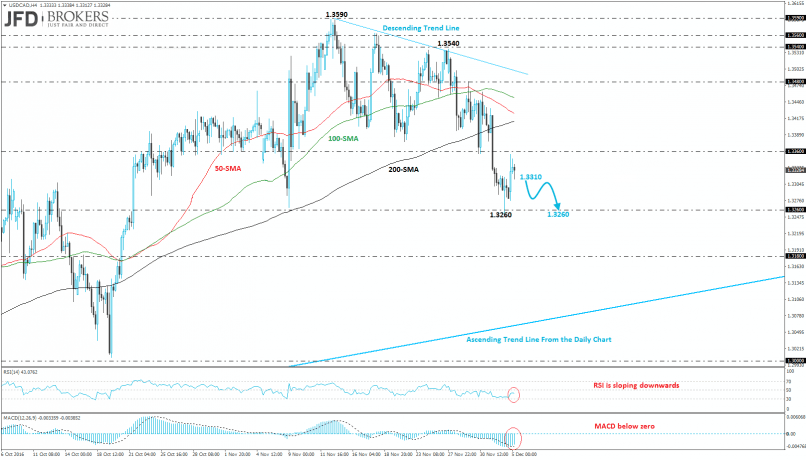
From a technical point of view, on the daily chart, the pair is establishing in an ascending move since May 2016 and hit a fresh eight-month high, early in November. Going to a lower timeframe, currently, the pair is developing under the short-term trend line and near the 1.3310 price level. Also, the commodity currency slipped below the 50-daily SMA and challenged the 1.3260 support level. Our expectation is a retest of the latter level as the technical indicators are holding below its mid-levels. The RSI indicator is sloping downwards while the MACD oscillator lies below the zero line and above its trigger line.
From a technical point of view, on the daily chart, the pair is establishing in an ascending move since May 2016 and hit a fresh eight-month high, early in November. Going to a lower timeframe, currently, the pair is developing under the short-term trend line and near the 1.3310 price level. Also, the commodity currency slipped below the 50-daily SMA and challenged the 1.3260 support level. Our expectation is a retest of the latter level as the technical indicators are holding below its mid-levels. The RSI indicator is sloping downwards while the MACD oscillator lies below the zero line and above its trigger line.
This member did not declare if he had a position on this financial instrument or a related financial instrument.
About author

Offline


Add a comment
Comments
0 comments on the analysis USD/CAD - 4H