USD/CAD - Daily - Technical analysis published on 11/04/2022 (GMT)
- 133
- 0
Click here for a new analysis!
- Timeframe : Daily
- - Analysis generated on
- Status : INVALID

Summary of the analysis

Additional analysis
Quotes
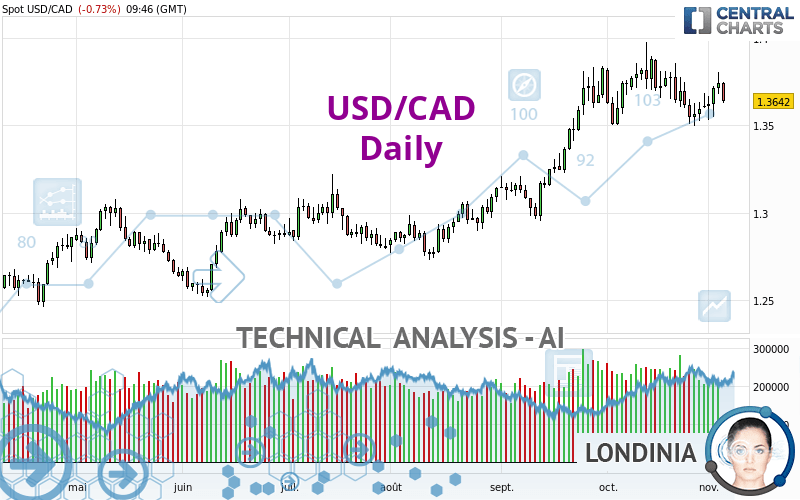
USD/CAD rating 1.3642 CAD. On the day, this instrument lost -0.74% with the lowest point at 1.3629 CAD and the highest point at 1.3746 CAD. The deviation from the price is +0.10% for the low point and -0.76% for the high point.Here is a more detailed summary of the historical variations registered by USD/CAD:
Near a new HIGH record (1 year)
Type : Bullish
Timeframe : Weekly
Near a new HIGH record (1st january)
Type : Bullish
Timeframe : Weekly
Near a new HIGH record (1 month)
Type : Bullish
Timeframe : Weekly
Technical
Technical analysis of this Daily chart of USD/CAD indicates that the overall trend is bullish. 71.43% of the signals given by moving averages are bullish. Caution: the neutral signals currently given by the short-term moving averages indicate that this bullish trend is showing signs of running out of steam. An assessment of moving averages reveals several bearish signals that could impact this trend:
Bearish price crossover with Moving Average 20
Type : Bearish
Timeframe : Daily
Bearish price crossover with adaptative moving average 20
Type : Bearish
Timeframe : Daily
On the 18 technical indicators analysed, 4 are bullish, 7 are neutral and 7 are bearish. But beware of excesses. The Central Indicators scanner currently detects this:
RSI indicator: bearish divergence
Type : Bearish
Timeframe : Daily
Pivot points : price is under support 1
Type : Neutral
Timeframe : Daily
Price is back over the pivot point
Type : Bullish
Timeframe : Weekly
Momentum indicator is back under 0
Type : Bearish
Timeframe : Daily
Williams %R indicator is back under -50
Type : Bearish
Timeframe : Daily
The analysis of the price chart with Central Patterns scanners does not return any result.
The Central Candlesticks scanner which studies Japanese candlesticks did not detect anything.
| S3 | S2 | S1 | Price | R1 | R2 | R3 | |
|---|---|---|---|---|---|---|---|
| ProTrendLines | 1.2986 | 1.3348 | 1.3550 | 1.3642 | 1.3752 | 1.3881 | 1.4567 |
| Change (%) | -4.81% | -2.16% | -0.67% | - | +0.81% | +1.75% | +6.78% |
| Change | -0.0656 | -0.0294 | -0.0092 | - | +0.0110 | +0.0239 | +0.0925 |
| Level | Major | Minor | Intermediate | - | Major | Intermediate | Major |
Attention could also be paid to pivot points to set price objectives:
| Pivot points | S3 | S2 | S1 | PP | R1 | R2 | R3 |
|---|---|---|---|---|---|---|---|
| Standard | 1.3555 | 1.3618 | 1.3681 | 1.3744 | 1.3807 | 1.3870 | 1.3933 |
| Camarilla | 1.3708 | 1.3720 | 1.3732 | 1.3743 | 1.3755 | 1.3766 | 1.3778 |
| Woodie | 1.3554 | 1.3618 | 1.3680 | 1.3744 | 1.3806 | 1.3870 | 1.3932 |
| Fibonacci | 1.3618 | 1.3667 | 1.3696 | 1.3744 | 1.3793 | 1.3822 | 1.3870 |
| Pivot points | S3 | S2 | S1 | PP | R1 | R2 | R3 |
|---|---|---|---|---|---|---|---|
| Standard | 1.3191 | 1.3343 | 1.3470 | 1.3622 | 1.3749 | 1.3901 | 1.4028 |
| Camarilla | 1.3519 | 1.3545 | 1.3570 | 1.3596 | 1.3622 | 1.3647 | 1.3673 |
| Woodie | 1.3178 | 1.3337 | 1.3457 | 1.3616 | 1.3736 | 1.3895 | 1.4015 |
| Fibonacci | 1.3343 | 1.3450 | 1.3516 | 1.3622 | 1.3729 | 1.3795 | 1.3901 |
| Pivot points | S3 | S2 | S1 | PP | R1 | R2 | R3 |
|---|---|---|---|---|---|---|---|
| Standard | 1.2931 | 1.3213 | 1.3413 | 1.3695 | 1.3895 | 1.4177 | 1.4377 |
| Camarilla | 1.3480 | 1.3524 | 1.3568 | 1.3612 | 1.3656 | 1.3700 | 1.3745 |
| Woodie | 1.2889 | 1.3193 | 1.3371 | 1.3675 | 1.3853 | 1.4157 | 1.4335 |
| Fibonacci | 1.3213 | 1.3398 | 1.3511 | 1.3695 | 1.3880 | 1.3993 | 1.4177 |
Numerical data
The following is the status of technical indicators and moving averages registered at the time this technical analysis was created:
| RSI (14): | 50.88 | |
| MACD (12,26,9): | 0.0033 | |
| Directional Movement: | 5.2718 | |
| AROON (14): | -57.1429 | |
| DEMA (21): | 1.3713 | |
| Parabolic SAR (0,02-0,02-0,2): | 1.3502 | |
| Elder Ray (13): | 0.0025 | |
| Super Trend (3,10): | 1.3395 | |
| Zig ZAG (10): | 1.3638 | |
| VORTEX (21): | 1.0204 | |
| Stochastique (14,3,5): | 52.91 | |
| TEMA (21): | 1.3650 | |
| Williams %R (14): | -60.45 | |
| Chande Momentum Oscillator (20): | -0.0135 | |
| Repulse (5,40,3): | -0.3739 | |
| ROCnROLL: | -1 | |
| TRIX (15,9): | 0.0555 | |
| Courbe Coppock: | 1.81 |
| MA7: | 1.3641 | |
| MA20: | 1.3701 | |
| MA50: | 1.3496 | |
| MA100: | 1.3207 | |
| MAexp7: | 1.3662 | |
| MAexp20: | 1.3652 | |
| MAexp50: | 1.3503 | |
| MAexp100: | 1.3295 | |
| Price / MA7: | +0.01% | |
| Price / MA20: | -0.43% | |
| Price / MA50: | +1.08% | |
| Price / MA100: | +3.29% | |
| Price / MAexp7: | -0.15% | |
| Price / MAexp20: | -0.07% | |
| Price / MAexp50: | +1.03% | |
| Price / MAexp100: | +2.61% |
News
Don't forget to follow the news on USD/CAD. At the time of publication of this analysis, the latest news was as follows:
-
 USD/CAD Forecast November 1, 2022
-
Technical Analysis: 21/10/2022 - USDCAD trapped below 1.3800; uptrend intact
-
USD/CAD Breakout | Tuesday Market Outlook with Michael Boutros
-
USD/CAD Technical Outlook: Big Reversal Sets Up the Downside
-
Technical Analysis: 14/10/2022 - USDCAD retraces after hitting fresh 29-month high
About author

Online


Add a comment
Comments
0 comments on the analysis USD/CAD - Daily