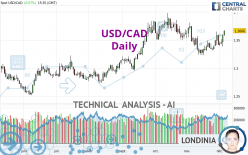
USD/CAD - Daily - Technical analysis published on 12/06/2022 (GMT)
- 123
- 0
Click here for a new analysis!
- Timeframe : Daily
- - Analysis generated on
- Status : LEVEL MAINTAINED

Summary of the analysis

Additional analysis
Quotes
USD/CAD rating 1.3666 CAD. The price registered an increase of +0.57% on the session with the lowest point at 1.3570 CAD and the highest point at 1.3667 CAD. The deviation from the price is +0.71% for the low point and -0.01% for the high point.A bearish opening was detected by the Central Gaps scanner. Sellers are trying to impose a bearish trend in the very short term.
Bearish opening
Type : Bearish
Timeframe : Openning
Here is a more detailed summary of the historical variations registered by USD/CAD:
Near a new HIGH record (1 year)
Type : Bullish
Timeframe : Weekly
Near a new HIGH record (1st january)
Type : Bullish
Timeframe : Weekly
Near a new LOW record (1 month)
Type : Bearish
Timeframe : Weekly
Technical
Technical analysis of USD/CAD in Daily shows a strongly overall bullish trend. 82.14% of the signals given by moving averages are bullish. This strongly bullish trend is supported by the strong bullish signals given by short-term moving averages. The Central Indicators scanner detects a bullish signal on moving averages that could impact this trend:
Bullish trend reversal : Moving Average 20
Type : Bullish
Timeframe : Daily
In fact, according to the parameters integrated into the Central Analyzer system, 17 technical indicators out of 18 analysed are currently bullish. But beware of excesses. The Central Indicators scanner currently detects this:
CCI indicator is overbought : over 100
Type : Neutral
Timeframe : Daily
Williams %R indicator is overbought : over -20
Type : Neutral
Timeframe : Daily
Pivot points : price is over resistance 1
Type : Neutral
Timeframe : Weekly
MACD indicator is back over 0
Type : Bullish
Timeframe : Daily
Central Patterns, the market scanner focusing on chart patterns, resistances and supports found these results:
Near horizontal resistance
Type : Bearish
Timeframe : Daily
Resistance of channel is broken
Type : Bullish
Timeframe : Daily
For a small rebound in the very short term, the Central Candlesticks scanner currently notes the presence of this bullish pattern in Japanese candlesticks:
Three white soldiers
Type : Bullish
Timeframe : Daily
| S3 | S2 | S1 | Price | R1 | R2 | R3 | |
|---|---|---|---|---|---|---|---|
| ProTrendLines | 1.2764 | 1.2986 | 1.3348 | 1.3666 | 1.3752 | 1.3881 | 1.4567 |
| Change (%) | -6.60% | -4.98% | -2.33% | - | +0.63% | +1.57% | +6.59% |
| Change | -0.0902 | -0.0680 | -0.0318 | - | +0.0086 | +0.0215 | +0.0901 |
| Level | Minor | Major | Intermediate | - | Major | Intermediate | Major |
To determine price objectives, it is also possible to use the pivot points. Here is the price position in relation to pivot points:
| Pivot points | S3 | S2 | S1 | PP | R1 | R2 | R3 |
|---|---|---|---|---|---|---|---|
| Standard | 1.3225 | 1.3304 | 1.3447 | 1.3526 | 1.3669 | 1.3748 | 1.3891 |
| Camarilla | 1.3528 | 1.3548 | 1.3569 | 1.3589 | 1.3609 | 1.3630 | 1.3650 |
| Woodie | 1.3256 | 1.3320 | 1.3478 | 1.3542 | 1.3700 | 1.3764 | 1.3922 |
| Fibonacci | 1.3304 | 1.3389 | 1.3442 | 1.3526 | 1.3611 | 1.3664 | 1.3748 |
| Pivot points | S3 | S2 | S1 | PP | R1 | R2 | R3 |
|---|---|---|---|---|---|---|---|
| Standard | 1.3093 | 1.3240 | 1.3353 | 1.3500 | 1.3613 | 1.3760 | 1.3873 |
| Camarilla | 1.3396 | 1.3419 | 1.3443 | 1.3467 | 1.3491 | 1.3515 | 1.3539 |
| Woodie | 1.3077 | 1.3232 | 1.3337 | 1.3492 | 1.3597 | 1.3752 | 1.3857 |
| Fibonacci | 1.3240 | 1.3339 | 1.3400 | 1.3500 | 1.3599 | 1.3660 | 1.3760 |
| Pivot points | S3 | S2 | S1 | PP | R1 | R2 | R3 |
|---|---|---|---|---|---|---|---|
| Standard | 1.2576 | 1.2901 | 1.3158 | 1.3483 | 1.3740 | 1.4065 | 1.4322 |
| Camarilla | 1.3255 | 1.3308 | 1.3362 | 1.3415 | 1.3468 | 1.3522 | 1.3575 |
| Woodie | 1.2542 | 1.2884 | 1.3124 | 1.3466 | 1.3706 | 1.4048 | 1.4288 |
| Fibonacci | 1.2901 | 1.3123 | 1.3261 | 1.3483 | 1.3705 | 1.3843 | 1.4065 |
Numerical data
The following is the status of technical indicators and moving averages registered at the time this technical analysis was created:
| RSI (14): | 59.81 | |
| MACD (12,26,9): | 0.0010 | |
| Directional Movement: | 17.1353 | |
| AROON (14): | 100.0000 | |
| DEMA (21): | 1.3474 | |
| Parabolic SAR (0,02-0,02-0,2): | 1.3364 | |
| Elder Ray (13): | 0.0132 | |
| Super Trend (3,10): | 1.3694 | |
| Zig ZAG (10): | 1.3662 | |
| VORTEX (21): | 1.0376 | |
| Stochastique (14,3,5): | 81.07 | |
| TEMA (21): | 1.3497 | |
| Williams %R (14): | -0.27 | |
| Chande Momentum Oscillator (20): | 0.0289 | |
| Repulse (5,40,3): | 1.8267 | |
| ROCnROLL: | 1 | |
| TRIX (15,9): | -0.0354 | |
| Courbe Coppock: | 2.32 |
| MA7: | 1.3521 | |
| MA20: | 1.3414 | |
| MA50: | 1.3568 | |
| MA100: | 1.3307 | |
| MAexp7: | 1.3527 | |
| MAexp20: | 1.3477 | |
| MAexp50: | 1.3459 | |
| MAexp100: | 1.3339 | |
| Price / MA7: | +1.07% | |
| Price / MA20: | +1.88% | |
| Price / MA50: | +0.72% | |
| Price / MA100: | +2.70% | |
| Price / MAexp7: | +1.03% | |
| Price / MAexp20: | +1.40% | |
| Price / MAexp50: | +1.54% | |
| Price / MAexp100: | +2.45% |
News
Don't forget to follow the news on USD/CAD. At the time of publication of this analysis, the latest news was as follows:
-
 USD/CAD Forecast December 5, 2022
-
Technical Analysis: 02/12/2022 - USDCAD steps on 20-SMA; bears still present
-
USD/CAD Forecast December 2, 2022
-
Technical Analysis: 25/11/2022 - USDCAD retreats as latest recovery fades
-
USD/CAD Forecast November 22, 2022
About author
Online


Add a comment
Comments
0 comments on the analysis USD/CAD - Daily