USD/CAD - Is Losing More Ground - Post New 27-Month Low at 1.2061 - 09/08/2017 (GMT)
- Who voted?
- 410
- 0
- Timeframe : Daily

USD/CAD Chart
Are you looking for opportunities in indices and forex?
DISCOVER LONDINIA OPPORTUNITIES...
DISCOVER LONDINIA OPPORTUNITIES...
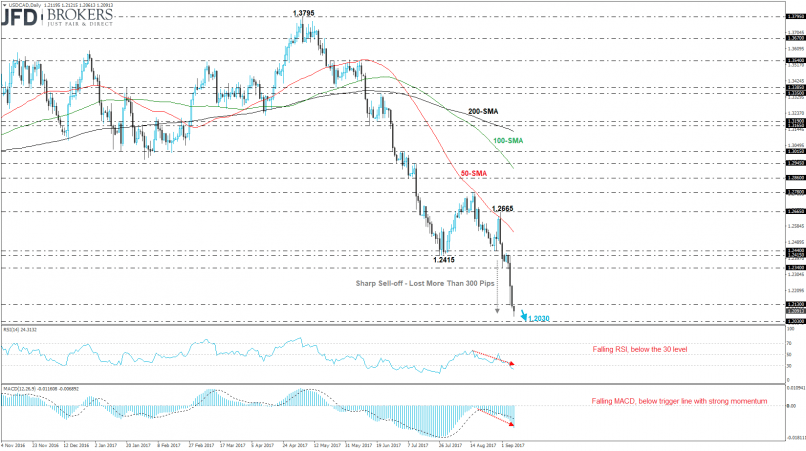
The commodity currency pair dropped more than 2% this week, recording four negative weekly sessions. The USD/CAD pair plummeted to a new 27-month low at 1.2061 early this morning and is approaching the next immediate support level at 1.2030, which we suggested in a previous analysis (see technical analysis here: http://bit.ly/2eN34AY).
The technical structure suggests further bearish movement as both are moving sharply lower on the short-term chart. The RSI indicator slipped beneath the 30 level and is now developing into the oversold zone, whilst the MACD oscillator fell below its trigger line and is moving with strong momentum in the negative zone.
The technical structure suggests further bearish movement as both are moving sharply lower on the short-term chart. The RSI indicator slipped beneath the 30 level and is now developing into the oversold zone, whilst the MACD oscillator fell below its trigger line and is moving with strong momentum in the negative zone.
This member did not declare if he had a position on this financial instrument or a related financial instrument.
About author

Offline


Add a comment
Comments
0 comments on the analysis USD/CAD - Daily