USD/CAD - Jumped and Remained Above the 23.6% Fibonacci Retracement Level - 10/05/2017 (GMT)
- Who voted?
- 406
- 0
- Timeframe : Daily

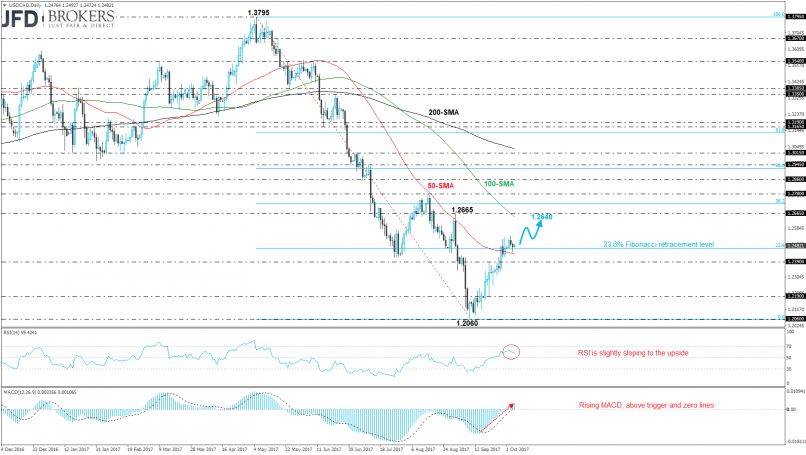
USD/CAD Chart
Are you looking for opportunities in indices and forex?
DISCOVER LONDINIA OPPORTUNITIES...
DISCOVER LONDINIA OPPORTUNITIES...
The U.S. dollar is developing choppy and fairly directionless against the Canadian dollar over the last four days. The price is trying to post a fourth straight green week, however, currently, is trading near its opening level. The USD/CAD pair remains above the 23.6% Fibonacci retracement level with high at 1.3795 and low at 1.2060, which overlaps with the 100-week SMA and our predictions is a jump higher slightly below the 1.2665 resistance level, which is near with the 100-day SMA.
The non-farm payrolls report tomorrow in the afternoon may have the ability to drive the pair to the latter level. On the daily chart, the RSI indicator is pointing to the upside in the positive territory. Also, the MACD oscillator is holding above the zero and trigger lines with weaker momentum than before.
The non-farm payrolls report tomorrow in the afternoon may have the ability to drive the pair to the latter level. On the daily chart, the RSI indicator is pointing to the upside in the positive territory. Also, the MACD oscillator is holding above the zero and trigger lines with weaker momentum than before.
This member declared not having a position on this financial instrument or a related financial instrument.
About author

Offline


Add a comment
Comments
0 comments on the analysis USD/CAD - Daily