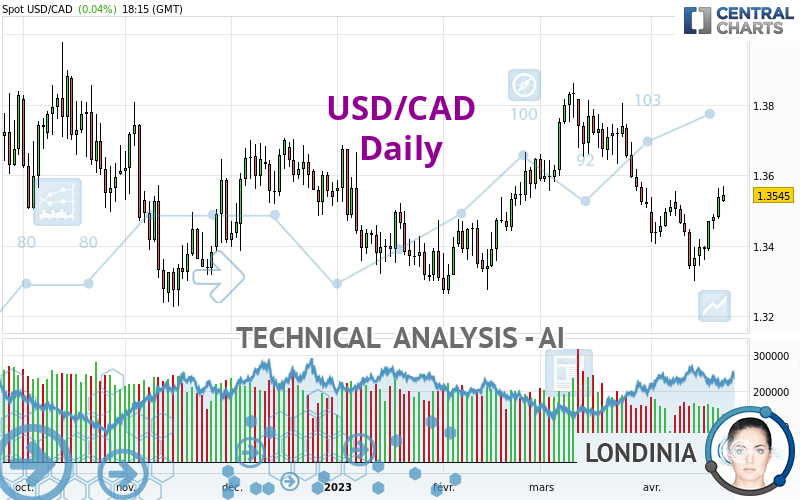
USD/CAD - Daily - Technical analysis published on 04/24/2023 (GMT)
- 138
- 0
Click here for a new analysis!
- Timeframe : Daily
- - Analysis generated on
- Status : LEVEL MAINTAINED
Summary of the analysis

Additional analysis
Quotes
USD/CAD rating 1.3545 CAD. The price has increased by +0.04% since the last closing and was between 1.3523 CAD and 1.3568 CAD. This implies that the price is at +0.16% from its lowest and at -0.17% from its highest.A bearish opening was detected by the Central Gaps scanner. Sellers are trying to impose a bearish trend in the very short term.
Bearish opening
Type : Bearish
Timeframe : Openning
Here is a more detailed summary of the historical variations registered by USD/CAD:
Near a new HIGH record (1 year)
Type : Bullish
Timeframe : Weekly
Near a new HIGH record (1st january)
Type : Bullish
Timeframe : Weekly
Near a new HIGH record (1 month)
Type : Bullish
Timeframe : Weekly
Technical
A technical analysis in Daily of this USD/CAD chart shows a slightly bullish trend. Only 57.14% of the signals given by moving averages are bullish. This slightly bullish trend is not supported by the signals currently being given by short-term moving averages. The Central Indicators scanner detects bullish signals on moving averages that could impact this trend:
Bullish trend reversal : adaptative moving average 20
Type : Bullish
Timeframe : Daily
Bullish trend reversal : adaptative moving average 50
Type : Bullish
Timeframe : Daily
Bullish trend reversal : adaptative moving average 100
Type : Bullish
Timeframe : Daily
An assessment of technical indicators shows a moderate bullish signal.
Caution: the Central Indicators scanner currently detects an excess:
Williams %R indicator is overbought : over -20
Type : Neutral
Timeframe : Daily
An analysis of the price chart with the Central Patterns scanner (detector of chart patterns and resistances and supports) shows several results that can have an impact on the price change:
Near horizontal resistance
Type : Bearish
Timeframe : Daily
Resistance of channel is broken
Type : Bullish
Timeframe : Daily
No result was found by the Central Candlesticks scanner on Japanese candlesticks.
| S3 | S2 | S1 | Price | R1 | R2 | |
|---|---|---|---|---|---|---|
| ProTrendLines | 1.2986 | 1.3279 | 1.3516 | 1.3545 | 1.3752 | 1.4567 |
| Change (%) | -4.13% | -1.96% | -0.21% | - | +1.53% | +7.55% |
| Change | -0.0559 | -0.0266 | -0.0029 | - | +0.0207 | +0.1022 |
| Level | Major | Major | Intermediate | - | Major | Major |
Pivot points can also be used to set your price objectives. Here is the price situation in relation to pivot points:
| Pivot points | S3 | S2 | S1 | PP | R1 | R2 | R3 |
|---|---|---|---|---|---|---|---|
| Standard | 1.3400 | 1.3438 | 1.3488 | 1.3526 | 1.3576 | 1.3614 | 1.3664 |
| Camarilla | 1.3515 | 1.3523 | 1.3531 | 1.3539 | 1.3547 | 1.3555 | 1.3563 |
| Woodie | 1.3407 | 1.3441 | 1.3495 | 1.3529 | 1.3583 | 1.3617 | 1.3671 |
| Fibonacci | 1.3438 | 1.3471 | 1.3492 | 1.3526 | 1.3559 | 1.3580 | 1.3614 |
| Pivot points | S3 | S2 | S1 | PP | R1 | R2 | R3 |
|---|---|---|---|---|---|---|---|
| Standard | 1.3179 | 1.3260 | 1.3400 | 1.3481 | 1.3621 | 1.3702 | 1.3842 |
| Camarilla | 1.3478 | 1.3499 | 1.3519 | 1.3539 | 1.3559 | 1.3580 | 1.3600 |
| Woodie | 1.3208 | 1.3275 | 1.3429 | 1.3496 | 1.3650 | 1.3717 | 1.3871 |
| Fibonacci | 1.3260 | 1.3345 | 1.3397 | 1.3481 | 1.3566 | 1.3618 | 1.3702 |
| Pivot points | S3 | S2 | S1 | PP | R1 | R2 | R3 |
|---|---|---|---|---|---|---|---|
| Standard | 1.3040 | 1.3274 | 1.3395 | 1.3629 | 1.3750 | 1.3984 | 1.4105 |
| Camarilla | 1.3419 | 1.3452 | 1.3485 | 1.3517 | 1.3550 | 1.3582 | 1.3615 |
| Woodie | 1.2985 | 1.3246 | 1.3340 | 1.3601 | 1.3695 | 1.3956 | 1.4050 |
| Fibonacci | 1.3274 | 1.3409 | 1.3493 | 1.3629 | 1.3764 | 1.3848 | 1.3984 |
Numerical data
The following are the details of the technical indicators and moving averages that were collected to generate this technical analysis:
| RSI (14): | 53.79 | |
| MACD (12,26,9): | -0.0030 | |
| Directional Movement: | 3.3155 | |
| AROON (14): | 42.8571 | |
| DEMA (21): | 1.3453 | |
| Parabolic SAR (0,02-0,02-0,2): | 1.3327 | |
| Elder Ray (13): | 0.0066 | |
| Super Trend (3,10): | 1.3588 | |
| Zig ZAG (10): | 1.3545 | |
| VORTEX (21): | 0.8762 | |
| Stochastique (14,3,5): | 84.46 | |
| TEMA (21): | 1.3436 | |
| Williams %R (14): | -8.99 | |
| Chande Momentum Oscillator (20): | 0.0048 | |
| Repulse (5,40,3): | 0.6843 | |
| ROCnROLL: | 1 | |
| TRIX (15,9): | -0.0509 | |
| Courbe Coppock: | 0.73 |
| MA7: | 1.3455 | |
| MA20: | 1.3474 | |
| MA50: | 1.3571 | |
| MA100: | 1.3528 | |
| MAexp7: | 1.3484 | |
| MAexp20: | 1.3496 | |
| MAexp50: | 1.3527 | |
| MAexp100: | 1.3503 | |
| Price / MA7: | +0.67% | |
| Price / MA20: | +0.53% | |
| Price / MA50: | -0.19% | |
| Price / MA100: | +0.13% | |
| Price / MAexp7: | +0.45% | |
| Price / MAexp20: | +0.36% | |
| Price / MAexp50: | +0.13% | |
| Price / MAexp100: | +0.31% |
News
The last news published on USD/CAD at the time of the generation of this analysis was as follows:
-
 Technical Analysis: 21/04/2023 - USDCAD rebounds strongly from April lows
-
Trading the Trend: Long USD/CAD
-
Technical Analysis: 12/04/2023 - USDCAD posts bearish cross within SMAs
-
Technical Analysis: 06/04/2023 - USDCAD recoups some losses after decline halts
-
Technical Analysis: 31/03/2023 - Is the sell-off in USDCAD overdone?
About author

Online


Add a comment
Comments
0 comments on the analysis USD/CAD - Daily