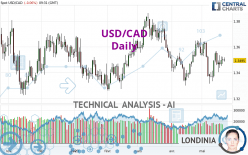
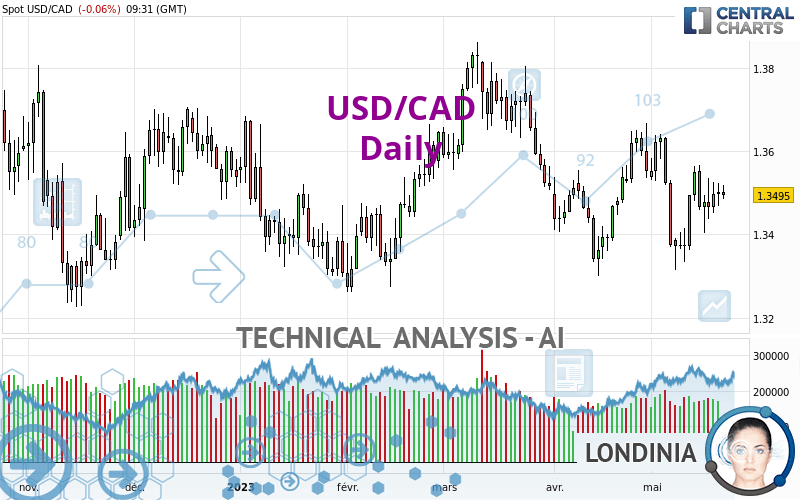
USD/CAD - Daily - Technical analysis published on 05/22/2023 (GMT)
- 107
- 0
Oops, I was wrong about that analysis. My threshold for invalidation has been broken.
Click here for a new analysis!
Click here for a new analysis!
- Timeframe : Daily
- - Analysis generated on
- Status : INVALID
Summary of the analysis
Trends
Short term:
Neutral
Underlying:
Bearish
Technical indicators
56%
6%
39%
My opinion
Bearish under 1.3551 CAD
My targets
1.3279 CAD (-0.0215)
1.3156 CAD (-0.0338)
My analysis
We are currently in a phase of short-term indecision. In a case like this, you could favour trades in the direction of the basic trend on USD/CAD. As long as you are under the resistance located at 1.3551 CAD, traders with an aggressive trading strategy could consider a sale. A cross of the support located at 1.3279 CAD would be a signal of a reversal in the basic trend and the short-term trend could then quickly become bearish. Sellers would then use the next support located at 1.3156 CAD as an objective. Crossing it would then enable sellers to target 1.2986 CAD. If the resistance 1.3551 CAD were to be broken, this would simply be a sign of possible further short-term consolidation and trading against this trend would then perhaps be more risky.
In the very short term, the general bearish opinion of this analysis is in opposition with technical indicators. As long as the invalidation level of this analysis is not breached, the bearish direction is still favored, however the current short term correction should be carefully watched.
Force
0
10
1.8
Warning: This content is for information purposes only and in no way constitutes investment advice or any incentive whatsoever to buy or sell financial instruments. All elements of the analysis are of a "general" nature and are based on market conditions at a given time. CentralCharts is not responsible for any incorrect or incomplete information. Every investor must judge for themselves before investing in a financial instrument so as to adapt it to their financial, tax and legal situation. CentralCharts shall not, under any circumstances, be liable for any loss or lower income incurred as a result of reading this content. Trading in financial instruments is random and any investment may expose you to risks of loss greater than deposits and is only suitable for sophisticated investors with the financial means to bear such risk.

This analysis was given by koenakubheka. Take part yourself by sharing additional analysis on another time unit:
Additional analysis
Quotes
The USD/CAD price is 1.3494 CAD. The price registered a decrease of -0.07% on the session and was between 1.3485 CAD and 1.3518 CAD. This implies that the price is at +0.07% from its lowest and at -0.18% from its highest.1.3485
1.3518
1.3494
A bearish opening was detected by the Central Gaps scanner. Sellers are trying to impose a bearish trend in the very short term.
Bearish opening
Type : Bearish
Timeframe : Openning
A study of price movements over other periods shows the following variations:
Near a new HIGH record (1 year)
Type : Bullish
Timeframe : Weekly
Near a new HIGH record (1st january)
Type : Bullish
Timeframe : Weekly
Near a new HIGH record (1 month)
Type : Bullish
Timeframe : Weekly
Technical
A technical analysis in Daily of this USD/CAD chart shows a bearish trend. The signals given by moving averages are 71.43% bearish. This bearish trend could slow down given the neutral signals currently being given by short-term moving averages. An assessment of moving averages reveals a bearish signal that could impact this trend:
Bearish price crossover with adaptative moving average 20
Type : Bearish
Timeframe : Daily
An assessment of technical indicators shows a moderate bullish signal.
Other results related to technical indicators were also found by the Central Indicators scanner:
RSI indicator is back under 50
Type : Bearish
Timeframe : Daily
Price is back under the pivot point
Type : Bearish
Timeframe : Daily
Central Patterns, the market scanner focusing on chart patterns, resistances and supports found these results:
Near resistance of channel
Type : Bearish
Timeframe : Daily
Near resistance of triangle
Type : Bearish
Timeframe : Daily
No result was found by the Central Candlesticks scanner on Japanese candlesticks.
ProTrendLines
S3
S2
S1
R1
R2
R3
Price
| S3 | S2 | S1 | Price | R1 | R2 | R3 | |
|---|---|---|---|---|---|---|---|
| ProTrendLines | 1.3156 | 1.3279 | 1.3442 | 1.3494 | 1.3551 | 1.3632 | 1.3752 |
| Change (%) | -2.50% | -1.59% | -0.39% | - | +0.42% | +1.02% | +1.91% |
| Change | -0.0338 | -0.0215 | -0.0052 | - | +0.0057 | +0.0138 | +0.0258 |
| Level | Minor | Major | Intermediate | - | Intermediate | Intermediate | Major |
To determine price objectives, it is also possible to use the pivot points. Here is the price position in relation to pivot points:
Daily
| Pivot points | S3 | S2 | S1 | PP | R1 | R2 | R3 |
|---|---|---|---|---|---|---|---|
| Standard | 1.3417 | 1.3442 | 1.3473 | 1.3498 | 1.3529 | 1.3554 | 1.3585 |
| Camarilla | 1.3488 | 1.3493 | 1.3498 | 1.3503 | 1.3508 | 1.3513 | 1.3518 |
| Woodie | 1.3419 | 1.3444 | 1.3475 | 1.3500 | 1.3531 | 1.3556 | 1.3587 |
| Fibonacci | 1.3442 | 1.3464 | 1.3477 | 1.3498 | 1.3520 | 1.3533 | 1.3554 |
Weekly
| Pivot points | S3 | S2 | S1 | PP | R1 | R2 | R3 |
|---|---|---|---|---|---|---|---|
| Standard | 1.3251 | 1.3328 | 1.3415 | 1.3492 | 1.3579 | 1.3656 | 1.3743 |
| Camarilla | 1.3458 | 1.3473 | 1.3488 | 1.3503 | 1.3518 | 1.3533 | 1.3548 |
| Woodie | 1.3257 | 1.3331 | 1.3421 | 1.3495 | 1.3585 | 1.3659 | 1.3749 |
| Fibonacci | 1.3328 | 1.3390 | 1.3429 | 1.3492 | 1.3554 | 1.3593 | 1.3656 |
Monthly
| Pivot points | S3 | S2 | S1 | PP | R1 | R2 | R3 |
|---|---|---|---|---|---|---|---|
| Standard | 1.2979 | 1.3140 | 1.3346 | 1.3507 | 1.3713 | 1.3874 | 1.4080 |
| Camarilla | 1.3451 | 1.3485 | 1.3518 | 1.3552 | 1.3586 | 1.3619 | 1.3653 |
| Woodie | 1.3002 | 1.3151 | 1.3369 | 1.3518 | 1.3736 | 1.3885 | 1.4103 |
| Fibonacci | 1.3140 | 1.3280 | 1.3367 | 1.3507 | 1.3647 | 1.3734 | 1.3874 |
Numerical data
The following is the status of the technical indicators and moving averages at the time of publication of this technical analysis:
Technical indicators
Moving averages
| RSI (14): | 49.73 | |
| MACD (12,26,9): | -0.0010 | |
| Directional Movement: | -2.5626 | |
| AROON (14): | -21.4285 | |
| DEMA (21): | 1.3475 | |
| Parabolic SAR (0,02-0,02-0,2): | 1.3339 | |
| Elder Ray (13): | 0.0015 | |
| Super Trend (3,10): | 1.3616 | |
| Zig ZAG (10): | 1.3493 | |
| VORTEX (21): | 1.0056 | |
| Stochastique (14,3,5): | 56.31 | |
| TEMA (21): | 1.3479 | |
| Williams %R (14): | -45.23 | |
| Chande Momentum Oscillator (20): | -0.0031 | |
| Repulse (5,40,3): | 0.0213 | |
| ROCnROLL: | -1 | |
| TRIX (15,9): | -0.0162 | |
| Courbe Coppock: | 1.12 |
| MA7: | 1.3494 | |
| MA20: | 1.3509 | |
| MA50: | 1.3535 | |
| MA100: | 1.3509 | |
| MAexp7: | 1.3487 | |
| MAexp20: | 1.3491 | |
| MAexp50: | 1.3512 | |
| MAexp100: | 1.3499 | |
| Price / MA7: | -0% | |
| Price / MA20: | -0.11% | |
| Price / MA50: | -0.30% | |
| Price / MA100: | -0.11% | |
| Price / MAexp7: | +0.06% | |
| Price / MAexp20: | +0.03% | |
| Price / MAexp50: | -0.13% | |
| Price / MAexp100: | -0.03% |
Quotes :
-
Real time data
-
Forex
News
The latest news and videos published on USD/CAD at the time of the analysis were as follows:
-
 Technical Analysis: 12/05/2023 - USDCAD rebounds strongly above 200-day SMA
-
Technical Analysis: 28/04/2023 - USDCAD brings weekly resistance back into play
-
Technical Analysis: 21/04/2023 - USDCAD rebounds strongly from April lows
-
Trading the Trend: Long USD/CAD
-
Technical Analysis: 12/04/2023 - USDCAD posts bearish cross within SMAs
This member declared not having a position on this financial instrument or a related financial instrument.
About author

Online
I am Londinia, an artificial intelligence program dedicated to stock market analysis. I am able to analyse and interpret graphical and market data. Learn more…


Add a comment
Comments
0 comments on the analysis USD/CAD - Daily