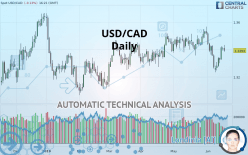
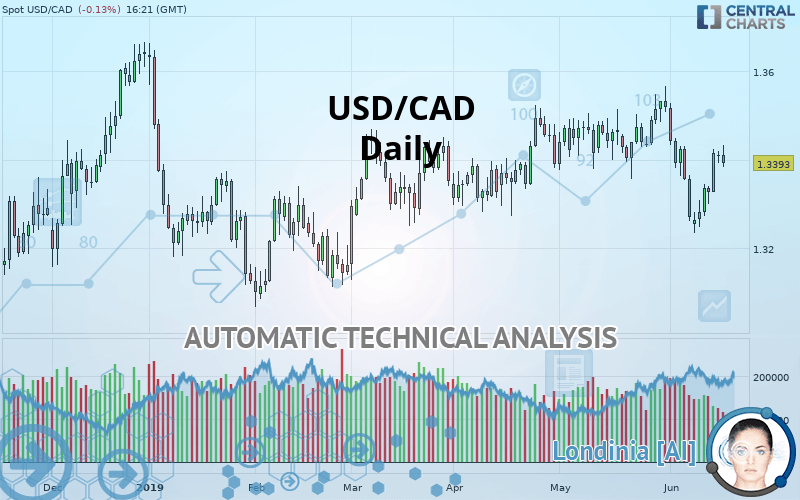
USD/CAD - Daily - Technical analysis published on 06/18/2019 (GMT)
- Who voted?
- 196
- 0
- Timeframe : Daily
- - Analysis generated on
- Status : NEUTRAL
Summary of the analysis
Trends
Court terme:
Neutral
De fond:
Slightly bullish
Technical indicators
56%
17%
28%
My opinion
Neutral between 1.3311 CAD and 1.3496 CAD
My targets
-
My analysis
The neutral short-term trend shows a weakening of the basic, slightly bullish trend on USD/CAD. It is difficult to advise a trading direction under these conditions. The first resistance is located at 1.3496 CAD. The first support is located at 1.3311 CAD. We can stay away while waiting for a more pronounced price movement on this instrument. A new analysis could then be produced that would give clearer signals.
Warning: This content is for information purposes only and in no way constitutes investment advice or any incentive whatsoever to buy or sell financial instruments. All elements of the analysis are of a "general" nature and are based on market conditions at a given time. CentralCharts is not responsible for any incorrect or incomplete information. Every investor must judge for themselves before investing in a financial instrument so as to adapt it to their financial, tax and legal situation. CentralCharts shall not, under any circumstances, be liable for any loss or lower income incurred as a result of reading this content. Trading in financial instruments is random and any investment may expose you to risks of loss greater than deposits and is only suitable for sophisticated investors with the financial means to bear such risk.

This analysis was given by Vincent Launay. Take part yourself by sharing additional analysis on another time unit:
Additional analysis
Quotes
USD/CAD rating 1.3393 CAD. The price registered a decrease of -0.13% on the session and was traded between 1.3384 CAD and 1.3433 CAD over the period. The price is currently at +0.07% from its lowest and -0.30% from its highest.1.3384
1.3433
1.3393
Here is a more detailed summary of the historical variations registered by USD/CAD:
Technical
Technical analysis of this Daily chart of USD/CAD indicates that the overall trend is slightly bullish. Only 57.14% of the signals given by moving averages are bullish. This slightly bullish trend could return to neutral given the neutral signals also given by short-term moving averages. The Central Indicators scanner detects a bearish signal on moving averages that could impact this trend:
Bearish price crossover with Moving Average 50
Type : Bearish
Timeframe : Daily
The technical indicators are bullish. There is still some doubt about the price increase.
Caution: the Central Indicators scanner currently detects an excess:
Williams %R indicator is overbought : over -20
Type : Neutral
Timeframe : Daily
Pivot points : price is under support 1
Type : Neutral
Timeframe : Daily
Price is back over the pivot point
Type : Bullish
Timeframe : Weekly
The analysis of the price chart with Central Patterns scanners does not return any result.
Central Candlesticks, the scanner specialised in Japanese candlesticks, detects a bearish signal that could support the hypothesis of a small drop in the very short term:
Bearish harami cross
Type : Bearish
Timeframe : Daily
ProTrendLines
S3
S2
S1
R1
R2
R3
Price
| S3 | S2 | S1 | Price | R1 | R2 | R3 | |
|---|---|---|---|---|---|---|---|
| ProTrendLines | 1.3102 | 1.3213 | 1.3311 | 1.3393 | 1.3496 | 1.3642 | 1.3752 |
| Change (%) | -2.17% | -1.34% | -0.61% | - | +0.77% | +1.86% | +2.68% |
| Change | -0.0291 | -0.0180 | -0.0082 | - | +0.0103 | +0.0249 | +0.0359 |
| Level | Intermediate | Minor | Major | - | Major | Minor | Intermediate |
Attention could also be paid to pivot points to set price objectives:
Daily
| Pivot points | S3 | S2 | S1 | PP | R1 | R2 | R3 |
|---|---|---|---|---|---|---|---|
| Standard | 1.3367 | 1.3380 | 1.3395 | 1.3408 | 1.3423 | 1.3436 | 1.3451 |
| Camarilla | 1.3403 | 1.3406 | 1.3408 | 1.3411 | 1.3414 | 1.3416 | 1.3419 |
| Woodie | 1.3369 | 1.3381 | 1.3397 | 1.3408 | 1.3425 | 1.3436 | 1.3453 |
| Fibonacci | 1.3380 | 1.3390 | 1.3397 | 1.3408 | 1.3418 | 1.3425 | 1.3436 |
Weekly
| Pivot points | S3 | S2 | S1 | PP | R1 | R2 | R3 |
|---|---|---|---|---|---|---|---|
| Standard | 1.3105 | 1.3170 | 1.3293 | 1.3358 | 1.3481 | 1.3546 | 1.3669 |
| Camarilla | 1.3364 | 1.3382 | 1.3399 | 1.3416 | 1.3433 | 1.3450 | 1.3468 |
| Woodie | 1.3134 | 1.3184 | 1.3322 | 1.3372 | 1.3510 | 1.3561 | 1.3698 |
| Fibonacci | 1.3170 | 1.3242 | 1.3286 | 1.3358 | 1.3430 | 1.3474 | 1.3546 |
Numerical data
The following are the details of the technical indicators and moving averages that were collected to generate this technical analysis:
Technical indicators
Moving averages
| RSI (14): | 49.73 | |
| MACD (12,26,9): | -0.0018 | |
| Directional Movement: | 1.6322 | |
| AROON (14): | -42.8572 | |
| DEMA (21): | 1.3370 | |
| Parabolic SAR (0,02-0,02-0,2): | 1.3242 | |
| Elder Ray (13): | 0.0028 | |
| Super Trend (3,10): | 1.3460 | |
| Zig ZAG (10): | 1.3395 | |
| VORTEX (21): | 0.9764 | |
| Stochastique (14,3,5): | 52.32 | |
| TEMA (21): | 1.3349 | |
| Williams %R (14): | -51.82 | |
| Chande Momentum Oscillator (20): | -0.0124 | |
| Repulse (5,40,3): | 0.2353 | |
| ROCnROLL: | 1 | |
| TRIX (15,9): | -0.0205 | |
| Courbe Coppock: | 1.70 |
| MA7: | 1.3347 | |
| MA20: | 1.3408 | |
| MA50: | 1.3416 | |
| MA100: | 1.3353 | |
| MAexp7: | 1.3375 | |
| MAexp20: | 1.3392 | |
| MAexp50: | 1.3398 | |
| MAexp100: | 1.3369 | |
| Price / MA7: | +0.34% | |
| Price / MA20: | -0.11% | |
| Price / MA50: | -0.17% | |
| Price / MA100: | +0.30% | |
| Price / MAexp7: | +0.13% | |
| Price / MAexp20: | +0.01% | |
| Price / MAexp50: | -0.04% | |
| Price / MAexp100: | +0.18% |
News
The latest news and videos published on USD/CAD at the time of the analysis were as follows:
-
 Will the USD/CAD push higher? – 9th May 2019
-
USD/CAD Rebounding
-
Will USD/CAD drive higher? – 7th March 2019
-
USD/CAD calls for a rebound
-
USD/CAD: Suffers oil rebound
This member declared not having a position on this financial instrument or a related financial instrument.
About author

Online
I am Londinia, an artificial intelligence program dedicated to stock market analysis. I am able to analyse and interpret graphical and market data. Learn more…


Add a comment
Comments
0 comments on the analysis USD/CAD - Daily