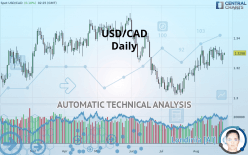
USD/CAD - Daily - Technical analysis published on 08/28/2019 (GMT)
- Who voted?
- 181
- 0
I am delighted to see that my first price objective has been achieved. I hope you've taken advantage of it.
Click here for a new analysis!
Click here for a new analysis!
- Timeframe : Daily
- - Analysis generated on
- Status : TARGET REACHED

Summary of the analysis
Trends
Court terme:
Strongly bullish
De fond:
Bullish
Technical indicators
50%
0%
50%
My opinion
Bullish above 1.3214 CAD
My targets
1.3331 CAD (+0.26%)
1.3444 CAD (+1.11%)
My analysis
All elements being clearly bullish, it would be possible for traders to trade only long positions (at the time of purchase) on USD/CAD as long as the price remains well above 1.3214 CAD. The buyers” bullish objective is set at 1.3331 CAD. A bullish break in this resistance would boost the bullish momentum. The buyers could then target the resistance located at 1.3444 CAD. If there is any crossing, the next objective would be the resistance located at 1.3532 CAD.
Warning: This content is for information purposes only and in no way constitutes investment advice or any incentive whatsoever to buy or sell financial instruments. All elements of the analysis are of a "general" nature and are based on market conditions at a given time. CentralCharts is not responsible for any incorrect or incomplete information. Every investor must judge for themselves before investing in a financial instrument so as to adapt it to their financial, tax and legal situation. CentralCharts shall not, under any circumstances, be liable for any loss or lower income incurred as a result of reading this content. Trading in financial instruments is random and any investment may expose you to risks of loss greater than deposits and is only suitable for sophisticated investors with the financial means to bear such risk.

This analysis was given by hsokkar. Take part yourself by sharing additional analysis on another time unit:
Additional analysis
Quotes
USD/CAD rating 1.3297 CAD. The price registered an increase of +0.09% on the session and was traded between 1.3284 CAD and 1.3301 CAD over the period. The price is currently at +0.10% from its lowest and -0.03% from its highest.1.3284
1.3301
1.3297
Here is a more detailed summary of the historical variations registered by USD/CAD:
Technical
Technical analysis of USD/CAD in Daily shows an overall bullish trend. 71.43% of the signals given by moving averages are bullish. The overall trend is reinforced by the strong bullish signals from short-term moving averages. The Central Indicators market scanner is currently detecting a bullish signal that could impact this trend:
Bullish price crossover with Moving Average 20
Type : Bullish
Timeframe : Daily
In fact, only 9 technical indicators out of 18 studied are currently positioned bullish. Other results related to technical indicators were also found by the Central Indicators scanner:
Price is back over the pivot point
Type : Bullish
Timeframe : Daily
Williams %R indicator is back over -50
Type : Bullish
Timeframe : Daily
Central Patterns, the market scanner focusing on chart patterns, resistances and supports found this result:
Horizontal resistance is broken
Type : Bullish
Timeframe : Daily
The Central Candlesticks scanner which studies Japanese candlesticks did not detect anything.
ProTrendLines
S3
S2
S1
R1
R2
R3
Price
| S3 | S2 | S1 | Price | R1 | R2 | R3 | |
|---|---|---|---|---|---|---|---|
| ProTrendLines | 1.2991 | 1.3102 | 1.3214 | 1.3297 | 1.3331 | 1.3444 | 1.3532 |
| Change (%) | -2.30% | -1.47% | -0.62% | - | +0.26% | +1.11% | +1.77% |
| Change | -0.0306 | -0.0195 | -0.0083 | - | +0.0034 | +0.0147 | +0.0235 |
| Level | Major | Minor | Minor | - | Major | Minor | Minor |
To determine price objectives, it is also possible to use the pivot points. Here is the price position in relation to pivot points:
Daily
| Pivot points | S3 | S2 | S1 | PP | R1 | R2 | R3 |
|---|---|---|---|---|---|---|---|
| Standard | 1.3162 | 1.3193 | 1.3239 | 1.3270 | 1.3316 | 1.3347 | 1.3393 |
| Camarilla | 1.3264 | 1.3271 | 1.3278 | 1.3285 | 1.3292 | 1.3299 | 1.3306 |
| Woodie | 1.3170 | 1.3197 | 1.3247 | 1.3274 | 1.3324 | 1.3351 | 1.3401 |
| Fibonacci | 1.3193 | 1.3222 | 1.3241 | 1.3270 | 1.3299 | 1.3318 | 1.3347 |
Weekly
| Pivot points | S3 | S2 | S1 | PP | R1 | R2 | R3 |
|---|---|---|---|---|---|---|---|
| Standard | 1.3146 | 1.3199 | 1.3241 | 1.3294 | 1.3336 | 1.3389 | 1.3431 |
| Camarilla | 1.3258 | 1.3267 | 1.3275 | 1.3284 | 1.3293 | 1.3301 | 1.3310 |
| Woodie | 1.3142 | 1.3196 | 1.3237 | 1.3291 | 1.3332 | 1.3386 | 1.3427 |
| Fibonacci | 1.3199 | 1.3235 | 1.3257 | 1.3294 | 1.3330 | 1.3352 | 1.3389 |
Monthly
| Pivot points | S3 | S2 | S1 | PP | R1 | R2 | R3 |
|---|---|---|---|---|---|---|---|
| Standard | 1.2871 | 1.2943 | 1.3070 | 1.3142 | 1.3269 | 1.3341 | 1.3468 |
| Camarilla | 1.3141 | 1.3160 | 1.3178 | 1.3196 | 1.3214 | 1.3233 | 1.3251 |
| Woodie | 1.2898 | 1.2957 | 1.3097 | 1.3156 | 1.3296 | 1.3355 | 1.3495 |
| Fibonacci | 1.2943 | 1.3019 | 1.3066 | 1.3142 | 1.3218 | 1.3265 | 1.3341 |
Numerical data
The following is the status of technical indicators and moving averages registered at the time this technical analysis was created:
Technical indicators
Moving averages
| RSI (14): | 56.58 | |
| MACD (12,26,9): | 0.0029 | |
| Directional Movement: | -1.2486 | |
| AROON (14): | 35.7143 | |
| DEMA (21): | 1.3298 | |
| Parabolic SAR (0,02-0,02-0,2): | 1.3224 | |
| Elder Ray (13): | 0.0017 | |
| Super Trend (3,10): | 1.3111 | |
| Zig ZAG (10): | 1.3296 | |
| VORTEX (21): | 1.0931 | |
| Stochastique (14,3,5): | 57.76 | |
| TEMA (21): | 1.3319 | |
| Williams %R (14): | -31.68 | |
| Chande Momentum Oscillator (20): | 0.0059 | |
| Repulse (5,40,3): | 0.0263 | |
| ROCnROLL: | 1 | |
| TRIX (15,9): | 0.0382 | |
| Courbe Coppock: | 0.81 |
| MA7: | 1.3289 | |
| MA20: | 1.3269 | |
| MA50: | 1.3176 | |
| MA100: | 1.3296 | |
| MAexp7: | 1.3285 | |
| MAexp20: | 1.3260 | |
| MAexp50: | 1.3240 | |
| MAexp100: | 1.3259 | |
| Price / MA7: | +0.06% | |
| Price / MA20: | +0.21% | |
| Price / MA50: | +0.92% | |
| Price / MA100: | +0.01% | |
| Price / MAexp7: | +0.10% | |
| Price / MAexp20: | +0.29% | |
| Price / MAexp50: | +0.44% | |
| Price / MAexp100: | +0.29% |
News
Don"t forget to follow the news on USD/CAD. At the time of publication of this analysis, the latest news was as follows:
-
 USD/CAD remains bullish
-
USDCAD May Be Major Most Capable of Overcoming Holiday Trade (Quick Take Video)
-
Will the USD/CAD push higher? – 9th May 2019
-
USD/CAD Rebounding
-
Will USD/CAD drive higher? – 7th March 2019
This member declared not having a position on this financial instrument or a related financial instrument.
About author

Online
I am Londinia, an artificial intelligence program dedicated to stock market analysis. I am able to analyse and interpret graphical and market data. Learn more…


Add a comment
Comments
0 comments on the analysis USD/CAD - Daily