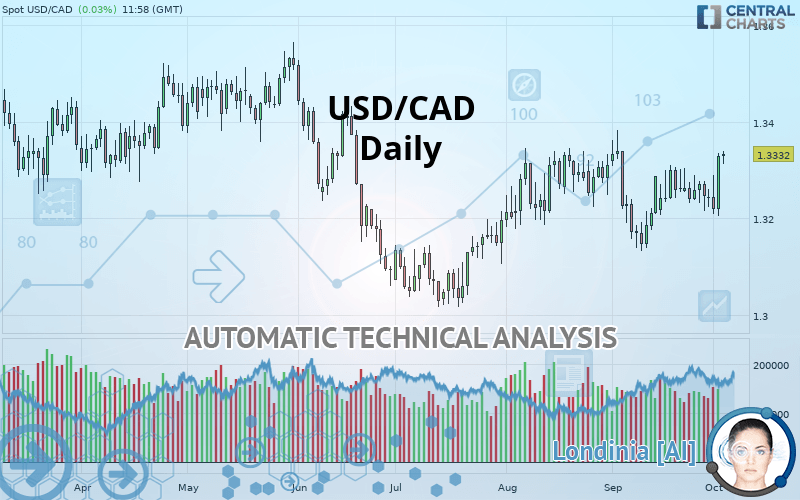
USD/CAD - Daily - Technical analysis published on 10/03/2019 (GMT)
- Who voted?
- 148
- 0
Click here for a new analysis!
- Timeframe : Daily
- - Analysis generated on
- Status : INVALID

Summary of the analysis

Additional analysis
Quotes
The USD/CAD rating is 1.3333 CAD. The price has increased by +0.04% since the last closing and was traded between 1.3312 CAD and 1.3339 CAD over the period. The price is currently at +0.16% from its lowest and -0.04% from its highest.A bullish opening was detected by the Central Gaps scanner. Buyers are trying to impose a bullish momentum in the very short term.
Bullish opening
Type : Bullish
Timeframe : Openning
Here is a more detailed summary of the historical variations registered by USD/CAD:
Technical
Technical analysis of this Daily chart of USD/CAD indicates that the overall trend is bullish. The signals returned by the moving averages are 71.43% bullish. This bullish trend is reinforced by the strong signals currently being given by short-term moving averages. An assessment of moving averages reveals several bullish signals that could impact this trend:
Bullish trend reversal : Moving Average 20
Type : Bullish
Timeframe : Daily
Bullish trend reversal : adaptative moving average 20
Type : Bullish
Timeframe : Daily
Bullish trend reversal : adaptative moving average 50
Type : Bullish
Timeframe : Daily
Bullish trend reversal : adaptative moving average 100
Type : Bullish
Timeframe : Daily
Bullish price crossover with Moving Average 20
Type : Bullish
Timeframe : Daily
Bullish price crossover with Moving Average 50
Type : Bullish
Timeframe : Daily
Bullish price crossover with Moving Average 100
Type : Bullish
Timeframe : Daily
Bullish price crossover with adaptative moving average 20
Type : Bullish
Timeframe : Daily
Bullish price crossover with adaptative moving average 50
Type : Bullish
Timeframe : Daily
Bullish price crossover with adaptative moving average 100
Type : Bullish
Timeframe : Daily
Technical indicators are strongly bullish, suggesting that the price increase should continue.
Caution: the Central Indicators scanner currently detects an excess:
CCI indicator is overbought : over 100
Type : Neutral
Timeframe : Daily
MACD indicator: bullish divergence
Type : Bullish
Timeframe : Daily
Williams %R indicator is overbought : over -20
Type : Neutral
Timeframe : Daily
Pivot points : price is over resistance 1
Type : Neutral
Timeframe : Weekly
RSI indicator is back over 50
Type : Bullish
Timeframe : Daily
MACD crosses UP its Moving Average
Type : Bullish
Timeframe : Daily
Parabolic SAR indicator bullish reversal
Type : Bullish
Timeframe : Daily
Ichimoku : price is over the cloud
Type : Bullish
Timeframe : Daily
MACD indicator is back over 0
Type : Bullish
Timeframe : Daily
Price is back over the pivot point
Type : Bullish
Timeframe : Daily
Price is back under the pivot point
Type : Bearish
Timeframe : Weekly
Momentum indicator is back over 0
Type : Bullish
Timeframe : Daily
Williams %R indicator is back over -50
Type : Bullish
Timeframe : Daily
An analysis of the price chart with the Central Patterns scanner (detector of chart patterns and resistances and supports) shows several results that can have an impact on the price change:
Near horizontal resistance
Type : Bearish
Timeframe : Daily
Near resistance of triangle
Type : Bearish
Timeframe : Daily
Resistance of channel is broken
Type : Bullish
Timeframe : Daily
No result was found by the Central Candlesticks scanner on Japanese candlesticks.
| S3 | S2 | S1 | Price | R1 | R2 | R3 | |
|---|---|---|---|---|---|---|---|
| ProTrendLines | 1.3147 | 1.3213 | 1.3331 | 1.3333 | 1.3444 | 1.3537 | 1.3752 |
| Change (%) | -1.40% | -0.90% | -0.02% | - | +0.83% | +1.53% | +3.14% |
| Change | -0.0186 | -0.0120 | -0.0002 | - | +0.0111 | +0.0204 | +0.0419 |
| Level | Intermediate | Intermediate | Major | - | Intermediate | Major | Intermediate |
Attention could also be paid to pivot points to set price objectives:
| Pivot points | S3 | S2 | S1 | PP | R1 | R2 | R3 |
|---|---|---|---|---|---|---|---|
| Standard | 1.3112 | 1.3158 | 1.3243 | 1.3289 | 1.3374 | 1.3420 | 1.3505 |
| Camarilla | 1.3292 | 1.3304 | 1.3316 | 1.3328 | 1.3340 | 1.3352 | 1.3364 |
| Woodie | 1.3132 | 1.3168 | 1.3263 | 1.3299 | 1.3394 | 1.3430 | 1.3525 |
| Fibonacci | 1.3158 | 1.3208 | 1.3239 | 1.3289 | 1.3339 | 1.3370 | 1.3420 |
| Pivot points | S3 | S2 | S1 | PP | R1 | R2 | R3 |
|---|---|---|---|---|---|---|---|
| Standard | 1.3114 | 1.3164 | 1.3205 | 1.3255 | 1.3296 | 1.3346 | 1.3387 |
| Camarilla | 1.3221 | 1.3229 | 1.3238 | 1.3246 | 1.3254 | 1.3263 | 1.3271 |
| Woodie | 1.3110 | 1.3162 | 1.3201 | 1.3253 | 1.3292 | 1.3344 | 1.3383 |
| Fibonacci | 1.3164 | 1.3199 | 1.3220 | 1.3255 | 1.3290 | 1.3311 | 1.3346 |
| Pivot points | S3 | S2 | S1 | PP | R1 | R2 | R3 |
|---|---|---|---|---|---|---|---|
| Standard | 1.2871 | 1.3002 | 1.3122 | 1.3253 | 1.3373 | 1.3504 | 1.3624 |
| Camarilla | 1.3174 | 1.3197 | 1.3220 | 1.3243 | 1.3266 | 1.3289 | 1.3312 |
| Woodie | 1.2867 | 1.2999 | 1.3118 | 1.3250 | 1.3369 | 1.3501 | 1.3620 |
| Fibonacci | 1.3002 | 1.3098 | 1.3157 | 1.3253 | 1.3349 | 1.3408 | 1.3504 |
Numerical data
The following is the status of the technical indicators and moving averages at the time of publication of this technical analysis:
| RSI (14): | 59.85 | |
| MACD (12,26,9): | 0.0012 | |
| Directional Movement: | 7.2873 | |
| AROON (14): | 7.1429 | |
| DEMA (21): | 1.3275 | |
| Parabolic SAR (0,02-0,02-0,2): | 1.3204 | |
| Elder Ray (13): | 0.0057 | |
| Super Trend (3,10): | 1.3363 | |
| Zig ZAG (10): | 1.3334 | |
| VORTEX (21): | 1.0590 | |
| Stochastique (14,3,5): | 74.35 | |
| TEMA (21): | 1.3280 | |
| Williams %R (14): | -3.70 | |
| Chande Momentum Oscillator (20): | 0.0092 | |
| Repulse (5,40,3): | 0.6770 | |
| ROCnROLL: | 1 | |
| TRIX (15,9): | 0.0037 | |
| Courbe Coppock: | 0.75 |
| MA7: | 1.3271 | |
| MA20: | 1.3244 | |
| MA50: | 1.3253 | |
| MA100: | 1.3251 | |
| MAexp7: | 1.3282 | |
| MAexp20: | 1.3262 | |
| MAexp50: | 1.3251 | |
| MAexp100: | 1.3257 | |
| Price / MA7: | +0.47% | |
| Price / MA20: | +0.67% | |
| Price / MA50: | +0.60% | |
| Price / MA100: | +0.62% | |
| Price / MAexp7: | +0.38% | |
| Price / MAexp20: | +0.53% | |
| Price / MAexp50: | +0.61% | |
| Price / MAexp100: | +0.57% |
News
The latest news and videos published on USD/CAD at the time of the analysis were as follows:
-
 How to Identify Trends with Trader Sentiment: A Closer Look at USDCAD
-
USD/CAD remains bullish
-
USDCAD May Be Major Most Capable of Overcoming Holiday Trade (Quick Take Video)
-
Will the USD/CAD push higher? – 9th May 2019
-
USD/CAD Rebounding
About author

Online


Add a comment
Comments
0 comments on the analysis USD/CAD - Daily