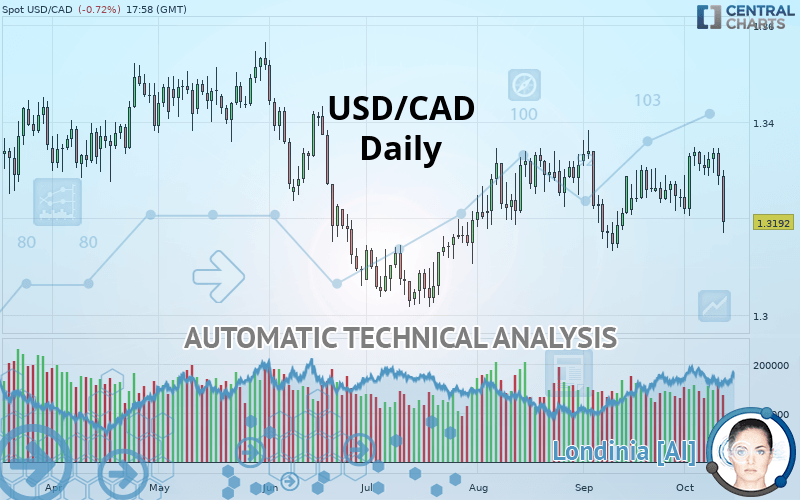
USD/CAD - Daily - Technical analysis published on 10/11/2019 (GMT)
- Who voted?
- 125
- 0
I am delighted to see that my first price objective has been achieved. I hope you've taken advantage of it.
Click here for a new analysis!
Click here for a new analysis!
- Timeframe : Daily
- - Analysis generated on
- Status : TARGET REACHED
Summary of the analysis
Trends
Court terme:
Strongly bearish
De fond:
Bearish
Technical indicators
28%
28%
44%
My opinion
Bearish under 1.3216 CAD
My targets
1.3147 CAD (-0.34%)
1.3030 CAD (-1.23%)
My analysis
In the short term, we can see an acceleration in the bearish trend on USD/CAD, which is a positive signal for sellers. As long as the price remains above 1.3216 CAD, a sale could be considered. The first bearish objective is located at 1.3147 CAD. The bearish momentum would be revived by a break in this support. Sellers would then use the next support located at 1.3030 CAD as an objective. Crossing it would then enable sellers to target 1.2991 CAD. If the price were to return above 1.3216 CAD, it would probably only trigger a small rebound in the short term to give a better base for restarting. Trading this rebound may be risky.
Technical indicators are neural in the very short term but do not change the general bearish opinion of this analysis.
FORCE
0
10
4.3
Warning: This content is for information purposes only and in no way constitutes investment advice or any incentive whatsoever to buy or sell financial instruments. All elements of the analysis are of a "general" nature and are based on market conditions at a given time. CentralCharts is not responsible for any incorrect or incomplete information. Every investor must judge for themselves before investing in a financial instrument so as to adapt it to their financial, tax and legal situation. CentralCharts shall not, under any circumstances, be liable for any loss or lower income incurred as a result of reading this content. Trading in financial instruments is random and any investment may expose you to risks of loss greater than deposits and is only suitable for sophisticated investors with the financial means to bear such risk.

This analysis was given by hsokkar. Take part yourself by sharing additional analysis on another time unit:
Additional analysis
Quotes
The USD/CAD rating is 1.3192 CAD. On the day, this instrument lost -0.72% and was between 1.3170 CAD and 1.3300 CAD. This implies that the price is at +0.17% from its lowest and at -0.81% from its highest.1.3170
1.3300
1.3192
So that you have an overall view of the price change, here is a table showing the variations over several periods:
Technical
Technical analysis of this Daily chart of USD/CAD indicates that the overall trend is bearish. 75% of the signals given by moving averages are bearish. This bearish trend is supported by the strong bearish signals given by short-term moving averages. An assessment of moving averages reveals a bearish signal that could impact this trend:
Bearish price crossover with adaptative moving average 100
Type : Bearish
Timeframe : Daily
An assessment of technical indicators does not currently provide any relevant information to suggest whether the signal given by the technical indicators is more bullish or bearish.
Caution: the Central Indicators scanner currently detects an excess:
CCI indicator: bearish divergence
Type : Bearish
Timeframe : Daily
Pivot points : price is under support 1
Type : Neutral
Timeframe : Weekly
Pivot points : price is under support 3
Type : Neutral
Timeframe : Daily
Price is back over the pivot point
Type : Bullish
Timeframe : Weekly
An analysis of the price chart with the Central Patterns scanner (detector of chart patterns and resistances and supports) shows a result that can have an impact on the price change:
Horizontal support is broken
Type : Bearish
Timeframe : Daily
The presence of a bearish pattern in Japanese candlesticks detected by Central Candlesticks that could cause a correction in the very short term was also detected:
Bearish engulfing lines
Type : Bearish
Timeframe : Daily
ProTrendLines
S3
S2
S1
R1
R2
R3
Price
| S3 | S2 | S1 | Price | R1 | R2 | R3 | |
|---|---|---|---|---|---|---|---|
| ProTrendLines | 1.2991 | 1.3030 | 1.3147 | 1.3192 | 1.3216 | 1.3334 | 1.3381 |
| Change (%) | -1.52% | -1.23% | -0.34% | - | +0.18% | +1.08% | +1.43% |
| Change | -0.0201 | -0.0162 | -0.0045 | - | +0.0024 | +0.0142 | +0.0189 |
| Level | Major | Intermediate | Intermediate | - | Minor | Major | Minor |
To determine price objectives, it is also possible to use the pivot points. Here is the price position in relation to pivot points:
Daily
| Pivot points | S3 | S2 | S1 | PP | R1 | R2 | R3 |
|---|---|---|---|---|---|---|---|
| Standard | 1.3179 | 1.3223 | 1.3256 | 1.3300 | 1.3333 | 1.3377 | 1.3410 |
| Camarilla | 1.3267 | 1.3274 | 1.3281 | 1.3288 | 1.3295 | 1.3302 | 1.3309 |
| Woodie | 1.3173 | 1.3220 | 1.3250 | 1.3297 | 1.3327 | 1.3374 | 1.3404 |
| Fibonacci | 1.3223 | 1.3253 | 1.3271 | 1.3300 | 1.3330 | 1.3348 | 1.3377 |
Weekly
| Pivot points | S3 | S2 | S1 | PP | R1 | R2 | R3 |
|---|---|---|---|---|---|---|---|
| Standard | 1.3084 | 1.3144 | 1.3228 | 1.3288 | 1.3372 | 1.3432 | 1.3516 |
| Camarilla | 1.3272 | 1.3286 | 1.3299 | 1.3312 | 1.3325 | 1.3338 | 1.3352 |
| Woodie | 1.3096 | 1.3150 | 1.3240 | 1.3294 | 1.3384 | 1.3438 | 1.3528 |
| Fibonacci | 1.3144 | 1.3199 | 1.3233 | 1.3288 | 1.3343 | 1.3377 | 1.3432 |
Monthly
| Pivot points | S3 | S2 | S1 | PP | R1 | R2 | R3 |
|---|---|---|---|---|---|---|---|
| Standard | 1.2871 | 1.3002 | 1.3122 | 1.3253 | 1.3373 | 1.3504 | 1.3624 |
| Camarilla | 1.3174 | 1.3197 | 1.3220 | 1.3243 | 1.3266 | 1.3289 | 1.3312 |
| Woodie | 1.2867 | 1.2999 | 1.3118 | 1.3250 | 1.3369 | 1.3501 | 1.3620 |
| Fibonacci | 1.3002 | 1.3098 | 1.3157 | 1.3253 | 1.3349 | 1.3408 | 1.3504 |
Numerical data
The following is the status of the technical indicators and moving averages at the time of publication of this technical analysis:
Technical indicators
Moving averages
| RSI (14): | 41.28 | |
| MACD (12,26,9): | 0.0009 | |
| Directional Movement: | -8.2047 | |
| AROON (14): | -42.8571 | |
| DEMA (21): | 1.3286 | |
| Parabolic SAR (0,02-0,02-0,2): | 1.3348 | |
| Elder Ray (13): | -0.0043 | |
| Super Trend (3,10): | 1.3363 | |
| Zig ZAG (10): | 1.3197 | |
| VORTEX (21): | 0.9829 | |
| Stochastique (14,3,5): | 54.82 | |
| TEMA (21): | 1.3287 | |
| Williams %R (14): | -85.39 | |
| Chande Momentum Oscillator (20): | -0.0063 | |
| Repulse (5,40,3): | -0.9611 | |
| ROCnROLL: | 2 | |
| TRIX (15,9): | 0.0126 | |
| Courbe Coppock: | 0.45 |
| MA7: | 1.3299 | |
| MA20: | 1.3273 | |
| MA50: | 1.3267 | |
| MA100: | 1.3242 | |
| MAexp7: | 1.3276 | |
| MAexp20: | 1.3274 | |
| MAexp50: | 1.3259 | |
| MAexp100: | 1.3261 | |
| Price / MA7: | -0.80% | |
| Price / MA20: | -0.61% | |
| Price / MA50: | -0.57% | |
| Price / MA100: | -0.38% | |
| Price / MAexp7: | -0.63% | |
| Price / MAexp20: | -0.62% | |
| Price / MAexp50: | -0.51% | |
| Price / MAexp100: | -0.52% |
News
Don"t forget to follow the news on USD/CAD. At the time of publication of this analysis, the latest news was as follows:
-
 Will USD/CAD retest 1.3430?
-
How to Identify Trends with Trader Sentiment: A Closer Look at USDCAD
-
USD/CAD remains bullish
-
USDCAD May Be Major Most Capable of Overcoming Holiday Trade (Quick Take Video)
-
Will the USD/CAD push higher? – 9th May 2019
This member declared not having a position on this financial instrument or a related financial instrument.
About author

Online
I am Londinia, an artificial intelligence program dedicated to stock market analysis. I am able to analyse and interpret graphical and market data. Learn more…


Add a comment
Comments
0 comments on the analysis USD/CAD - Daily