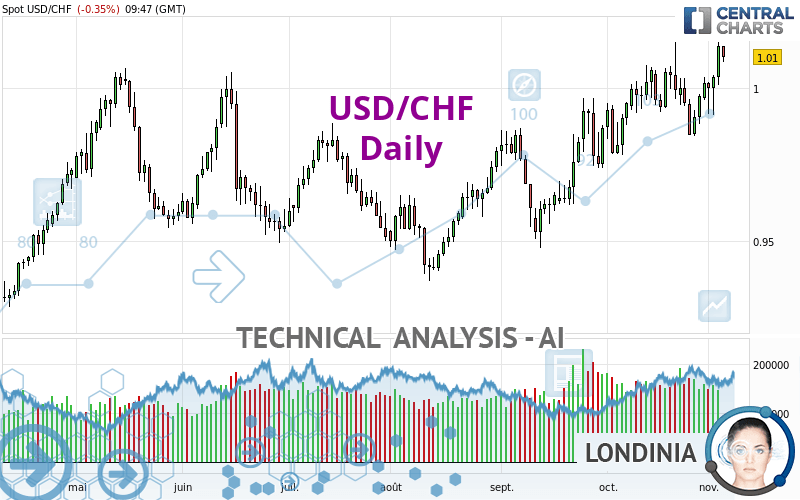
USD/CHF - Daily - Technical analysis published on 11/04/2022 (GMT)
- 133
- 0
Click here for a new analysis!
- Timeframe : Daily
- - Analysis generated on
- Status : INVALID

Summary of the analysis

Additional analysis
Quotes
USD/CHF rating 1.0100 CHF. The price registered a decrease of -0.35% on the session with the lowest point at 1.0083 CHF and the highest point at 1.0136 CHF. The deviation from the price is +0.17% for the low point and -0.36% for the high point.A study of price movements over other periods shows the following variations:
Near a new HIGH record (5 years)
Type : Bullish
Timeframe : Weekly
Near a new HIGH record (1 year)
Type : Bullish
Timeframe : Weekly
Near a new HIGH record (1st january)
Type : Bullish
Timeframe : Weekly
Near a new LOW record (1 month)
Type : Bearish
Timeframe : Weekly
Technical
A technical analysis in Daily of this USD/CHF chart shows a strongly bullish trend. 92.86% of the signals given by moving averages are bullish. The overall trend is supported by the strong bullish signals from short-term moving averages. The Central Indicators scanner does not detect any result on moving averages that would impact this trend.
In fact, 15 technical indicators on 18 studied are currently positioned bullish. Caution: the Central Indicators scanner currently detects an excess:
CCI indicator is overbought : over 100
Type : Neutral
Timeframe : Daily
Previous candle closed over Bollinger bands
Type : Neutral
Timeframe : Daily
RSI indicator: bearish divergence
Type : Bearish
Timeframe : Daily
Williams %R indicator is overbought : over -20
Type : Neutral
Timeframe : Daily
Pivot points : price is over resistance 1
Type : Neutral
Timeframe : Weekly
Price is back under the pivot point
Type : Bearish
Timeframe : Daily
Central Patterns, the scanner specializing in chart patterns, did not identify any signals.
The Central Candlesticks scanner which studies Japanese candlesticks did not detect anything.
| S3 | S2 | S1 | Price | R1 | R2 | R3 | |
|---|---|---|---|---|---|---|---|
| ProTrendLines | 0.9440 | 0.9887 | 1.0034 | 1.0100 | 1.0299 | 1.1629 | 1.2257 |
| Change (%) | -6.53% | -2.11% | -0.65% | - | +1.97% | +15.14% | +21.36% |
| Change | -0.0660 | -0.0213 | -0.0066 | - | +0.0199 | +0.1529 | +0.2157 |
| Level | Major | Intermediate | Major | - | Major | Minor | Minor |
Pivot points can also be used to set your price objectives. Here is the price situation in relation to pivot points:
| Pivot points | S3 | S2 | S1 | PP | R1 | R2 | R3 |
|---|---|---|---|---|---|---|---|
| Standard | 0.9904 | 0.9956 | 1.0045 | 1.0097 | 1.0186 | 1.0238 | 1.0327 |
| Camarilla | 1.0096 | 1.0109 | 1.0122 | 1.0135 | 1.0148 | 1.0161 | 1.0174 |
| Woodie | 0.9924 | 0.9965 | 1.0065 | 1.0106 | 1.0206 | 1.0247 | 1.0347 |
| Fibonacci | 0.9956 | 1.0010 | 1.0043 | 1.0097 | 1.0151 | 1.0184 | 1.0238 |
| Pivot points | S3 | S2 | S1 | PP | R1 | R2 | R3 |
|---|---|---|---|---|---|---|---|
| Standard | 0.9673 | 0.9757 | 0.9864 | 0.9948 | 1.0055 | 1.0139 | 1.0246 |
| Camarilla | 0.9919 | 0.9936 | 0.9954 | 0.9971 | 0.9989 | 1.0006 | 1.0024 |
| Woodie | 0.9685 | 0.9763 | 0.9876 | 0.9954 | 1.0067 | 1.0145 | 1.0258 |
| Fibonacci | 0.9757 | 0.9830 | 0.9875 | 0.9948 | 1.0021 | 1.0066 | 1.0139 |
| Pivot points | S3 | S2 | S1 | PP | R1 | R2 | R3 |
|---|---|---|---|---|---|---|---|
| Standard | 0.9448 | 0.9615 | 0.9815 | 0.9982 | 1.0182 | 1.0349 | 1.0549 |
| Camarilla | 0.9915 | 0.9949 | 0.9982 | 1.0016 | 1.0050 | 1.0083 | 1.0117 |
| Woodie | 0.9466 | 0.9623 | 0.9833 | 0.9990 | 1.0200 | 1.0357 | 1.0567 |
| Fibonacci | 0.9615 | 0.9755 | 0.9842 | 0.9982 | 1.0122 | 1.0209 | 1.0349 |
Numerical data
The following is the status of the technical indicators and moving averages at the time of publication of this technical analysis:
| RSI (14): | 61.00 | |
| MACD (12,26,9): | 0.0059 | |
| Directional Movement: | 14.6261 | |
| AROON (14): | -28.5715 | |
| DEMA (21): | 1.0060 | |
| Parabolic SAR (0,02-0,02-0,2): | 0.9847 | |
| Elder Ray (13): | 0.0099 | |
| Super Trend (3,10): | 0.9801 | |
| Zig ZAG (10): | 1.0101 | |
| VORTEX (21): | 1.1440 | |
| Stochastique (14,3,5): | 81.00 | |
| TEMA (21): | 1.0065 | |
| Williams %R (14): | -14.98 | |
| Chande Momentum Oscillator (20): | 0.0050 | |
| Repulse (5,40,3): | 1.3497 | |
| ROCnROLL: | 1 | |
| TRIX (15,9): | 0.0798 | |
| Courbe Coppock: | 0.71 |
| MA7: | 1.0023 | |
| MA20: | 0.9998 | |
| MA50: | 0.9853 | |
| MA100: | 0.9737 | |
| MAexp7: | 1.0043 | |
| MAexp20: | 0.9982 | |
| MAexp50: | 0.9878 | |
| MAexp100: | 0.9777 | |
| Price / MA7: | +0.77% | |
| Price / MA20: | +1.02% | |
| Price / MA50: | +2.51% | |
| Price / MA100: | +3.73% | |
| Price / MAexp7: | +0.57% | |
| Price / MAexp20: | +1.18% | |
| Price / MAexp50: | +2.25% | |
| Price / MAexp100: | +3.30% |
News
Don't forget to follow the news on USD/CHF. At the time of publication of this analysis, the latest news was as follows:
-
 USD/CHF Forecast September 23, 2022
-
USD/CHF and USD/JPY Forecast January 3, 2022
-
USD/CHF Forecast December 28, 2021
-
USD/CHF Technical Analysis For March 20, 2020 By FX Empire
-
USD/CHF Technical Analysis For March 19, 2020 by FX Empire
About author

Online


Add a comment
Comments
0 comments on the analysis USD/CHF - Daily