USD/CHF - Edged Higher Surpassing Strong Obstacles - 07/28/2017 (GMT)
- Who voted?
- 367
- 0
- Timeframe : Daily
USD/CHF Chart
Are you looking for opportunities in indices and forex?
DISCOVER LONDINIA OPPORTUNITIES...
DISCOVER LONDINIA OPPORTUNITIES...
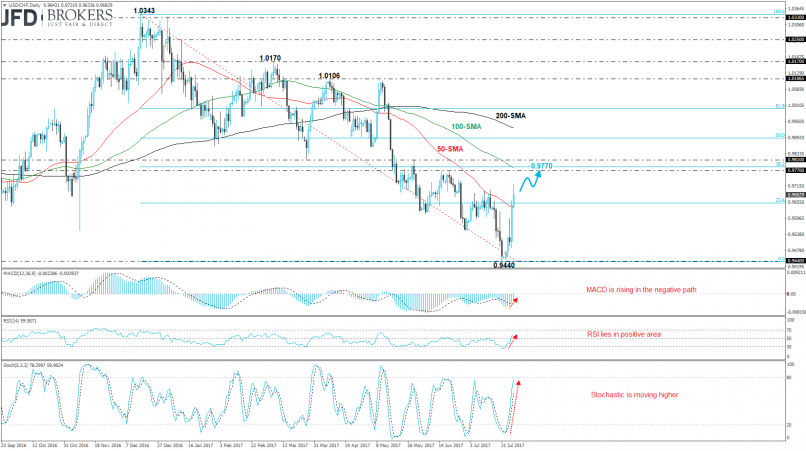
The U.S. dollar recovered the losses of the previous week session against the Swiss franc and is posting a bullish week. The USD/CHF pair recorded a strong green day and soared more than 1.3% in just one trading period. On a long-term timeframe, the price rebounded on the 50 and 100-SMAs and is moving slightly above them.
Looking on the short-term chart, the 50-SMA was a critical barrier for the bulls, however, the price jumped above it and is now approaching the 0.9770 – 0.9810 resistance area, which overlaps with the 38.2% Fibonacci retracement level of the last big downward move with high at 1.0343 and low at 0.9440. The MACD oscillator is rising in the bearish territory, whilst the RSI indicator and the stochastic oscillator are moving higher, approaching the positive paths.
Looking on the short-term chart, the 50-SMA was a critical barrier for the bulls, however, the price jumped above it and is now approaching the 0.9770 – 0.9810 resistance area, which overlaps with the 38.2% Fibonacci retracement level of the last big downward move with high at 1.0343 and low at 0.9440. The MACD oscillator is rising in the bearish territory, whilst the RSI indicator and the stochastic oscillator are moving higher, approaching the positive paths.
This member did not declare if he had a position on this financial instrument or a related financial instrument.
About author

Offline


Add a comment
Comments
0 comments on the analysis USD/CHF - Daily