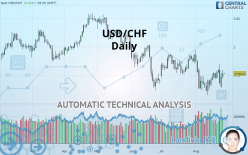
USD/CHF - Daily - Technical analysis published on 08/28/2019 (GMT)
- Who voted?
- 155
- 0
Oops, I was wrong about that analysis. My threshold for invalidation has been broken.
Click here for a new analysis!
Click here for a new analysis!
- Timeframe : Daily
- - Analysis generated on
- Status : INVALID

Summary of the analysis
Trends
Court terme:
Neutral
De fond:
Bearish
Technical indicators
72%
0%
28%
My opinion
Bearish under 0.9858 CHF
My targets
0.9723 CHF (-0.91%)
0.9534 CHF (-2.83%)
My analysis
Has the basic bearish trend slowed or is it lacking in power? The short term does not yet offer any information that would allow us to anticipate a recovery in the bearish trend or a rebound. Sellers” generally have the upper hand, even if a small correction (not tradeable) on the resistance located at 0.9858 CHF remains possible. It is advisable to trade USD/CHF with the greatest caution, while favouring short positions (for sale) as long as the price remains well below 0.9858 CHF. The next bearish objective for sellers is set at 0.9723 CHF. A bearish break of this support would revive the bearish momentum. The sellers could then target the support located at 0.9534 CHF. In case of crossing, the next objective would be the support located at 0.9446 CHF. PS: if there is a bullish break in the resistance located at 0.9858 CHF we suggest that you produce a new automated technical analysis. In fact, conditions should have changed. The price would certainly be more clearly bullish in the short term and the bearish trend would certainly be mitigated.
Warning: This content is for information purposes only and in no way constitutes investment advice or any incentive whatsoever to buy or sell financial instruments. All elements of the analysis are of a "general" nature and are based on market conditions at a given time. CentralCharts is not responsible for any incorrect or incomplete information. Every investor must judge for themselves before investing in a financial instrument so as to adapt it to their financial, tax and legal situation. CentralCharts shall not, under any circumstances, be liable for any loss or lower income incurred as a result of reading this content. Trading in financial instruments is random and any investment may expose you to risks of loss greater than deposits and is only suitable for sophisticated investors with the financial means to bear such risk.

This analysis was given by hsokkar. Take part yourself by sharing additional analysis on another time unit:
Additional analysis
Quotes
The USD/CHF price is 0.9812 CHF. On the day, this instrument gained +0.01% and was traded between 0.9810 CHF and 0.9817 CHF over the period. The price is currently at +0.02% from its lowest and -0.05% from its highest.0.9810
0.9817
0.9812
Here is a more detailed summary of the historical variations registered by USD/CHF:
Technical
A technical analysis in Daily of this USD/CHF chart shows a bearish trend. The signals given by moving averages are 75% bearish. This bearish trend could slow down given the neutral signals currently being given by short-term moving averages. An assessment of moving averages reveals a bullish signal that could impact this trend:
Bullish trend reversal : adaptative moving average 20
Type : Bullish
Timeframe : Daily
In fact, 13 technical indicators on 18 studied are currently positioned bullish. Central Indicators, the scanner specialised in technical indicators, has identified these signals:
RSI indicator is back over 50
Type : Bullish
Timeframe : Daily
Price is back over the pivot point
Type : Bullish
Timeframe : Daily
Price is back under the pivot point
Type : Bearish
Timeframe : Weekly
An analysis of the price chart with the Central Patterns scanner (detector of chart patterns and resistances and supports) shows a result that can have an impact on the price change:
Horizontal support is broken
Type : Bearish
Timeframe : Daily
The Central Candlesticks scanner which studies Japanese candlesticks did not detect anything.
ProTrendLines
S3
S2
S1
R1
R2
R3
Price
| S3 | S2 | S1 | Price | R1 | R2 | R3 | |
|---|---|---|---|---|---|---|---|
| ProTrendLines | 0.9446 | 0.9534 | 0.9723 | 0.9812 | 0.9858 | 0.9942 | 1.0025 |
| Change (%) | -3.73% | -2.83% | -0.91% | - | +0.47% | +1.32% | +2.17% |
| Change | -0.0366 | -0.0278 | -0.0089 | - | +0.0046 | +0.0130 | +0.0213 |
| Level | Minor | Intermediate | Major | - | Intermediate | Intermediate | Intermediate |
Pivot points can also be used to set your price objectives. Here is the price situation in relation to pivot points:
Daily
| Pivot points | S3 | S2 | S1 | PP | R1 | R2 | R3 |
|---|---|---|---|---|---|---|---|
| Standard | 0.9716 | 0.9746 | 0.9778 | 0.9808 | 0.9840 | 0.9870 | 0.9902 |
| Camarilla | 0.9794 | 0.9800 | 0.9805 | 0.9811 | 0.9817 | 0.9822 | 0.9828 |
| Woodie | 0.9718 | 0.9747 | 0.9780 | 0.9809 | 0.9842 | 0.9871 | 0.9904 |
| Fibonacci | 0.9746 | 0.9769 | 0.9784 | 0.9808 | 0.9831 | 0.9846 | 0.9870 |
Weekly
| Pivot points | S3 | S2 | S1 | PP | R1 | R2 | R3 |
|---|---|---|---|---|---|---|---|
| Standard | 0.9553 | 0.9644 | 0.9695 | 0.9786 | 0.9837 | 0.9928 | 0.9979 |
| Camarilla | 0.9707 | 0.9720 | 0.9733 | 0.9746 | 0.9759 | 0.9772 | 0.9785 |
| Woodie | 0.9533 | 0.9634 | 0.9675 | 0.9776 | 0.9817 | 0.9918 | 0.9959 |
| Fibonacci | 0.9644 | 0.9698 | 0.9732 | 0.9786 | 0.9840 | 0.9874 | 0.9928 |
Monthly
| Pivot points | S3 | S2 | S1 | PP | R1 | R2 | R3 |
|---|---|---|---|---|---|---|---|
| Standard | 0.9655 | 0.9717 | 0.9829 | 0.9891 | 1.0003 | 1.0065 | 1.0177 |
| Camarilla | 0.9894 | 0.9910 | 0.9926 | 0.9942 | 0.9958 | 0.9974 | 0.9990 |
| Woodie | 0.9681 | 0.9730 | 0.9855 | 0.9904 | 1.0029 | 1.0078 | 1.0203 |
| Fibonacci | 0.9717 | 0.9783 | 0.9824 | 0.9891 | 0.9957 | 0.9998 | 1.0065 |
Numerical data
The following is the status of technical indicators and moving averages registered at the time this technical analysis was created:
Technical indicators
Moving averages
| RSI (14): | 50.71 | |
| MACD (12,26,9): | -0.0011 | |
| Directional Movement: | -9.0263 | |
| AROON (14): | 57.1428 | |
| DEMA (21): | 0.9779 | |
| Parabolic SAR (0,02-0,02-0,2): | 0.9714 | |
| Elder Ray (13): | 0.0020 | |
| Super Trend (3,10): | 0.9923 | |
| Zig ZAG (10): | 0.9812 | |
| VORTEX (21): | 0.9464 | |
| Stochastique (14,3,5): | 66.97 | |
| TEMA (21): | 0.9791 | |
| Williams %R (14): | -29.36 | |
| Chande Momentum Oscillator (20): | 0.0121 | |
| Repulse (5,40,3): | 0.1969 | |
| ROCnROLL: | -1 | |
| TRIX (15,9): | -0.0299 | |
| Courbe Coppock: | 0.57 |
| MA7: | 0.9800 | |
| MA20: | 0.9778 | |
| MA50: | 0.9823 | |
| MA100: | 0.9947 | |
| MAexp7: | 0.9798 | |
| MAexp20: | 0.9799 | |
| MAexp50: | 0.9840 | |
| MAexp100: | 0.9891 | |
| Price / MA7: | +0.12% | |
| Price / MA20: | +0.35% | |
| Price / MA50: | -0.11% | |
| Price / MA100: | -1.36% | |
| Price / MAexp7: | +0.14% | |
| Price / MAexp20: | +0.13% | |
| Price / MAexp50: | -0.28% | |
| Price / MAexp100: | -0.80% |
News
Don"t forget to follow the news on USD/CHF. At the time of publication of this analysis, the latest news was as follows:
-
 USDCHF May Be the Best Dollar-Bullish Option for Trade War Status Quo (Quick Take Video)
-
USDCHF - One of My Favorite Alternative Dollar Scenario Options
-
USD/CHF Price Forecast – Grinding Through Important Triple-Top Formation
-
U.S. stocks set for flat open, USD/CHF looks up
-
Chart Perspective – USD/CHF, EUR/GBP/JPY Cross-rates, DAX & More
This member declared not having a position on this financial instrument or a related financial instrument.
About author

Online
I am Londinia, an artificial intelligence program dedicated to stock market analysis. I am able to analyse and interpret graphical and market data. Learn more…


Add a comment
Comments
0 comments on the analysis USD/CHF - Daily