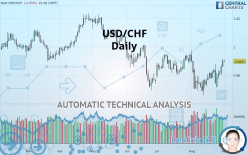
USD/CHF - Daily - Technical analysis published on 09/01/2019 (GMT)
- Who voted?
- 151
- 0
Click here for a new analysis!
- Timeframe : Daily
- - Analysis generated on
- Status : TARGET REACHED

Summary of the analysis

Additional analysis
Quotes
USD/CHF rating 0.9897 CHF. On the day, this instrument lost -0.05% and was between 0.9895 CHF and 0.9908 CHF. This implies that the price is at +0.02% from its lowest and at -0.11% from its highest.Here is a more detailed summary of the historical variations registered by USD/CHF:
Near a new HIGH record (5 years)
Type : Bullish
Timeframe : Weekly
Technical
Technical analysis of this Daily chart of USD/CHF indicates that the overall trend is slightly bullish. Only 57.14% of the signals given by moving averages are bullish. This slightly bullish trend is reinforced by the strong signals currently being given by short-term moving averages. The Central Indicators scanner detects bullish signals on moving averages that could impact this trend:
Bullish trend reversal : Moving Average 50
Type : Bullish
Timeframe : Daily
Bullish trend reversal : adaptative moving average 50
Type : Bullish
Timeframe : Daily
Bullish price crossover with Moving Average 50
Type : Bullish
Timeframe : Daily
Bullish price crossover with adaptative moving average 20
Type : Bullish
Timeframe : Daily
An assessment of technical indicators shows a strong bullish signal.
Caution: the Central Indicators scanner currently detects an excess:
CCI indicator is overbought : over 100
Type : Neutral
Timeframe : Daily
Williams %R indicator is overbought : over -20
Type : Neutral
Timeframe : Daily
Pivot points : price is over resistance 1
Type : Neutral
Timeframe : Daily
Pivot points : price is over resistance 1
Type : Neutral
Timeframe : Weekly
Price is back under the pivot point
Type : Bearish
Timeframe : Weekly
An analysis of the price chart with the Central Patterns scanner (detector of chart patterns and resistances and supports) shows a result that can have an impact on the price change:
Near resistance of channel
Type : Bearish
Timeframe : Daily
The Central Candlesticks scanner, specialised in Japanese candlesticks, did not identify any signals.
| S3 | S2 | S1 | Price | R1 | R2 | R3 | |
|---|---|---|---|---|---|---|---|
| ProTrendLines | 0.9723 | 0.9817 | 0.9858 | 0.9897 | 0.9942 | 1.0025 | 1.0109 |
| Change (%) | -1.76% | -0.81% | -0.39% | - | +0.45% | +1.29% | +2.14% |
| Change | -0.0174 | -0.0080 | -0.0039 | - | +0.0045 | +0.0128 | +0.0212 |
| Level | Major | Minor | Intermediate | - | Intermediate | Intermediate | Intermediate |
Pivot points can also be used to set your price objectives. Here is the price situation in relation to pivot points:
| Pivot points | S3 | S2 | S1 | PP | R1 | R2 | R3 |
|---|---|---|---|---|---|---|---|
| Standard | 0.9740 | 0.9770 | 0.9815 | 0.9845 | 0.9890 | 0.9920 | 0.9965 |
| Camarilla | 0.9839 | 0.9846 | 0.9853 | 0.9860 | 0.9867 | 0.9874 | 0.9881 |
| Woodie | 0.9748 | 0.9774 | 0.9823 | 0.9849 | 0.9898 | 0.9924 | 0.9973 |
| Fibonacci | 0.9770 | 0.9799 | 0.9816 | 0.9845 | 0.9874 | 0.9891 | 0.9920 |
| Pivot points | S3 | S2 | S1 | PP | R1 | R2 | R3 |
|---|---|---|---|---|---|---|---|
| Standard | 0.9553 | 0.9644 | 0.9695 | 0.9786 | 0.9837 | 0.9928 | 0.9979 |
| Camarilla | 0.9707 | 0.9720 | 0.9733 | 0.9746 | 0.9759 | 0.9772 | 0.9785 |
| Woodie | 0.9533 | 0.9634 | 0.9675 | 0.9776 | 0.9817 | 0.9918 | 0.9959 |
| Fibonacci | 0.9644 | 0.9698 | 0.9732 | 0.9786 | 0.9840 | 0.9874 | 0.9928 |
| Pivot points | S3 | S2 | S1 | PP | R1 | R2 | R3 |
|---|---|---|---|---|---|---|---|
| Standard | 0.9655 | 0.9717 | 0.9829 | 0.9891 | 1.0003 | 1.0065 | 1.0177 |
| Camarilla | 0.9894 | 0.9910 | 0.9926 | 0.9942 | 0.9958 | 0.9974 | 0.9990 |
| Woodie | 0.9681 | 0.9730 | 0.9855 | 0.9904 | 1.0029 | 1.0078 | 1.0203 |
| Fibonacci | 0.9717 | 0.9783 | 0.9824 | 0.9891 | 0.9957 | 0.9998 | 1.0065 |
Numerical data
The following are the details of the technical indicators and moving averages that were collected to generate this technical analysis:
| RSI (14): | 59.15 | |
| MACD (12,26,9): | 0.0003 | |
| Directional Movement: | 1.7456 | |
| AROON (14): | 92.8571 | |
| DEMA (21): | 0.9810 | |
| Parabolic SAR (0,02-0,02-0,2): | 0.9739 | |
| Elder Ray (13): | 0.0070 | |
| Super Trend (3,10): | 0.9923 | |
| Zig ZAG (10): | 0.9902 | |
| VORTEX (21): | 0.9802 | |
| Stochastique (14,3,5): | 85.86 | |
| TEMA (21): | 0.9834 | |
| Williams %R (14): | -6.18 | |
| Chande Momentum Oscillator (20): | 0.0168 | |
| Repulse (5,40,3): | 0.9735 | |
| ROCnROLL: | 1 | |
| TRIX (15,9): | -0.0204 | |
| Courbe Coppock: | 1.69 |
| MA7: | 0.9823 | |
| MA20: | 0.9780 | |
| MA50: | 0.9826 | |
| MA100: | 0.9944 | |
| MAexp7: | 0.9836 | |
| MAexp20: | 0.9814 | |
| MAexp50: | 0.9843 | |
| MAexp100: | 0.9890 | |
| Price / MA7: | +0.75% | |
| Price / MA20: | +1.20% | |
| Price / MA50: | +0.72% | |
| Price / MA100: | -0.47% | |
| Price / MAexp7: | +0.62% | |
| Price / MAexp20: | +0.85% | |
| Price / MAexp50: | +0.55% | |
| Price / MAexp100: | +0.07% |
News
The latest news and videos published on USD/CHF at the time of the analysis were as follows:
-
 USDCHF May Be the Best Dollar-Bullish Option for Trade War Status Quo (Quick Take Video)
-
USDCHF - One of My Favorite Alternative Dollar Scenario Options
-
USD/CHF Price Forecast – Grinding Through Important Triple-Top Formation
-
U.S. stocks set for flat open, USD/CHF looks up
-
Chart Perspective – USD/CHF, EUR/GBP/JPY Cross-rates, DAX & More
About author

Online


Add a comment
Comments
0 comments on the analysis USD/CHF - Daily