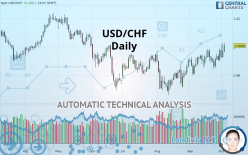
USD/CHF - Daily - Technical analysis published on 10/03/2019 (GMT)
- Who voted?
- 105
- 0
Click here for a new analysis!
- Timeframe : Daily
- - Analysis generated on
- Status : INVALID

Summary of the analysis

Additional analysis
Quotes
The USD/CHF rating is 1.0008 CHF. The price has increased by +0.40% since the last closing with the lowest point at 0.9961 CHF and the highest point at 1.0028 CHF. The deviation from the price is +0.47% for the low point and -0.20% for the high point.Here is a more detailed summary of the historical variations registered by USD/CHF:
Near a new HIGH record (5 years)
Type : Bullish
Timeframe : Weekly
Near a new LOW record (1 month)
Type : Bearish
Timeframe : Weekly
Technical
Technical analysis of this Daily chart of USD/CHF indicates that the overall trend is bullish. 75% of the signals given by moving averages are bullish. This bullish trend is supported by the strong bullish signals given by short-term moving averages. An assessment of moving averages reveals several bullish signals that could impact this trend:
Moving Average bullish crossovers : AMA20 & AMA50
Type : Bullish
Timeframe : Daily
Bullish price crossover with adaptative moving average 100
Type : Bullish
Timeframe : Daily
In fact, 14 technical indicators on 18 studied are currently positioned bullish. Caution: the Central Indicators scanner currently detects an excess:
CCI indicator is overbought : over 100
Type : Neutral
Timeframe : Daily
Williams %R indicator is overbought : over -20
Type : Neutral
Timeframe : Daily
Pivot points : price is over resistance 2
Type : Neutral
Timeframe : Weekly
MACD crosses UP its Moving Average
Type : Bullish
Timeframe : Daily
Williams %R indicator is back over -50
Type : Bullish
Timeframe : Daily
The Central Patterns scanner, which studies chart patterns, resistances and supports, has identified this signal:
Resistance of channel is broken
Type : Bullish
Timeframe : Daily
No result was found by the Central Candlesticks scanner on Japanese candlesticks.
| S3 | S2 | S1 | Price | R1 | R2 | R3 | |
|---|---|---|---|---|---|---|---|
| ProTrendLines | 0.9817 | 0.9891 | 0.9942 | 1.0008 | 1.0025 | 1.0109 | 1.0204 |
| Change (%) | -1.91% | -1.17% | -0.66% | - | +0.17% | +1.01% | +1.96% |
| Change | -0.0191 | -0.0117 | -0.0066 | - | +0.0017 | +0.0101 | +0.0196 |
| Level | Minor | Intermediate | Major | - | Major | Intermediate | Intermediate |
To determine price objectives, it is also possible to use the pivot points. Here is the price position in relation to pivot points:
| Pivot points | S3 | S2 | S1 | PP | R1 | R2 | R3 |
|---|---|---|---|---|---|---|---|
| Standard | 0.9811 | 0.9866 | 0.9917 | 0.9972 | 1.0023 | 1.0078 | 1.0129 |
| Camarilla | 0.9939 | 0.9949 | 0.9958 | 0.9968 | 0.9978 | 0.9987 | 0.9997 |
| Woodie | 0.9809 | 0.9865 | 0.9915 | 0.9971 | 1.0021 | 1.0077 | 1.0127 |
| Fibonacci | 0.9866 | 0.9907 | 0.9932 | 0.9972 | 1.0013 | 1.0038 | 1.0078 |
| Pivot points | S3 | S2 | S1 | PP | R1 | R2 | R3 |
|---|---|---|---|---|---|---|---|
| Standard | 0.9747 | 0.9796 | 0.9852 | 0.9901 | 0.9957 | 1.0006 | 1.0062 |
| Camarilla | 0.9880 | 0.9890 | 0.9899 | 0.9909 | 0.9919 | 0.9928 | 0.9938 |
| Woodie | 0.9752 | 0.9798 | 0.9857 | 0.9903 | 0.9962 | 1.0008 | 1.0067 |
| Fibonacci | 0.9796 | 0.9836 | 0.9861 | 0.9901 | 0.9941 | 0.9966 | 1.0006 |
| Pivot points | S3 | S2 | S1 | PP | R1 | R2 | R3 |
|---|---|---|---|---|---|---|---|
| Standard | 0.9663 | 0.9731 | 0.9853 | 0.9921 | 1.0043 | 1.0111 | 1.0233 |
| Camarilla | 0.9924 | 0.9941 | 0.9959 | 0.9976 | 0.9993 | 1.0011 | 1.0028 |
| Woodie | 0.9691 | 0.9745 | 0.9881 | 0.9935 | 1.0071 | 1.0125 | 1.0261 |
| Fibonacci | 0.9731 | 0.9803 | 0.9848 | 0.9921 | 0.9993 | 1.0038 | 1.0111 |
Numerical data
The following is the status of technical indicators and moving averages registered at the time this technical analysis was created:
| RSI (14): | 60.65 | |
| MACD (12,26,9): | 0.0028 | |
| Directional Movement: | 5.5537 | |
| AROON (14): | 50.0000 | |
| DEMA (21): | 0.9957 | |
| Parabolic SAR (0,02-0,02-0,2): | 0.9864 | |
| Elder Ray (13): | 0.0058 | |
| Super Trend (3,10): | 0.9790 | |
| Zig ZAG (10): | 1.0003 | |
| VORTEX (21): | 1.1234 | |
| Stochastique (14,3,5): | 67.58 | |
| TEMA (21): | 0.9971 | |
| Williams %R (14): | -13.59 | |
| Chande Momentum Oscillator (20): | 0.0075 | |
| Repulse (5,40,3): | 0.3036 | |
| ROCnROLL: | 1 | |
| TRIX (15,9): | 0.0374 | |
| Courbe Coppock: | 0.67 |
| MA7: | 0.9947 | |
| MA20: | 0.9926 | |
| MA50: | 0.9859 | |
| MA100: | 0.9888 | |
| MAexp7: | 0.9955 | |
| MAexp20: | 0.9921 | |
| MAexp50: | 0.9892 | |
| MAexp100: | 0.9902 | |
| Price / MA7: | +0.61% | |
| Price / MA20: | +0.83% | |
| Price / MA50: | +1.51% | |
| Price / MA100: | +1.21% | |
| Price / MAexp7: | +0.53% | |
| Price / MAexp20: | +0.88% | |
| Price / MAexp50: | +1.17% | |
| Price / MAexp100: | +1.07% |
News
Don"t forget to follow the news on USD/CHF. At the time of publication of this analysis, the latest news was as follows:
-
 USDCHF May Be the Best Dollar-Bullish Option for Trade War Status Quo (Quick Take Video)
-
USDCHF - One of My Favorite Alternative Dollar Scenario Options
-
USD/CHF Price Forecast – Grinding Through Important Triple-Top Formation
-
U.S. stocks set for flat open, USD/CHF looks up
-
Chart Perspective – USD/CHF, EUR/GBP/JPY Cross-rates, DAX & More
About author

Online


Add a comment
Comments
0 comments on the analysis USD/CHF - Daily