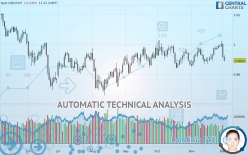
USD/CHF - Daily - Technical analysis published on 12/03/2019 (GMT)
- Who voted?
- 172
- 0
Click here for a new analysis!
- Timeframe : Daily
- - Analysis generated on
- Status : TARGET REACHED

Summary of the analysis

Additional analysis
Quotes
The USD/CHF rating is 0.9892 CHF. The price is lower by -0.23% since the last closing and was traded between 0.9884 CHF and 0.9927 CHF over the period. The price is currently at +0.08% from its lowest and -0.35% from its highest.A study of price movements over other periods shows the following variations:
Near a new HIGH record (5 years)
Type : Bullish
Timeframe : Weekly
Technical
A technical analysis in Daily of this USD/CHF chart shows a neutral trend. The strong bearish signals currently being given by short-term moving averages could allow the overall trend to return to a bearish trend. The Central Indicators market scanner is currently detecting several bearish signals that could impact this trend:
Bearish trend reversal : adaptative moving average 20
Type : Bearish
Timeframe : Daily
Bearish trend reversal : adaptative moving average 50
Type : Bearish
Timeframe : Daily
Bearish trend reversal : adaptative moving average 100
Type : Bearish
Timeframe : Daily
Bearish price crossover with Moving Average 20
Type : Bearish
Timeframe : Daily
Bearish price crossover with Moving Average 50
Type : Bearish
Timeframe : Daily
Bearish price crossover with adaptative moving average 20
Type : Bearish
Timeframe : Daily
Bearish price crossover with adaptative moving average 100
Type : Bearish
Timeframe : Daily
In fact, Central Analyzer took into account 18 technical indicators and the result was as follows: 6 are bullish, 6 are neutral and 6 are bearish. But beware of excesses. The Central Indicators scanner currently detects this:
CCI indicator: bearish divergence
Type : Bearish
Timeframe : Daily
Pivot points : price is under support 3
Type : Neutral
Timeframe : Weekly
RSI indicator is back under 50
Type : Bearish
Timeframe : Daily
Parabolic SAR indicator bearish reversal
Type : Bearish
Timeframe : Daily
Price is back over the pivot point
Type : Bullish
Timeframe : Weekly
Price is back under the pivot point
Type : Bearish
Timeframe : Daily
Williams %R indicator is back under -50
Type : Bearish
Timeframe : Daily
An analysis of the price chart with the Central Patterns scanner (detector of chart patterns and resistances and supports) shows several results that can have an impact on the price change:
Resistance of channel is broken
Type : Bullish
Timeframe : Daily
Horizontal support is broken
Type : Bearish
Timeframe : Daily
For a small setback in the very short term, the Central Candlesticks scanner currently notes the presence of this bearish pattern in Japanese candlesticks:
Bearish engulfing lines
Type : Bearish
Timeframe : Daily
| S3 | S2 | S1 | Price | R1 | R2 | R3 | |
|---|---|---|---|---|---|---|---|
| ProTrendLines | 0.9691 | 0.9841 | 0.9888 | 0.9892 | 0.9942 | 1.0025 | 1.0109 |
| Change (%) | -2.03% | -0.52% | -0.04% | - | +0.51% | +1.34% | +2.19% |
| Change | -0.0201 | -0.0051 | -0.0004 | - | +0.0050 | +0.0133 | +0.0217 |
| Level | Major | Intermediate | Minor | - | Major | Major | Minor |
To determine price objectives, it is also possible to use the pivot points. Here is the price position in relation to pivot points:
| Pivot points | S3 | S2 | S1 | PP | R1 | R2 | R3 |
|---|---|---|---|---|---|---|---|
| Standard | 0.9783 | 0.9847 | 0.9881 | 0.9945 | 0.9979 | 1.0043 | 1.0077 |
| Camarilla | 0.9888 | 0.9897 | 0.9906 | 0.9915 | 0.9924 | 0.9933 | 0.9942 |
| Woodie | 0.9768 | 0.9840 | 0.9866 | 0.9938 | 0.9964 | 1.0036 | 1.0062 |
| Fibonacci | 0.9847 | 0.9884 | 0.9908 | 0.9945 | 0.9982 | 1.0006 | 1.0043 |
| Pivot points | S3 | S2 | S1 | PP | R1 | R2 | R3 |
|---|---|---|---|---|---|---|---|
| Standard | 0.9903 | 0.9931 | 0.9966 | 0.9994 | 1.0029 | 1.0057 | 1.0092 |
| Camarilla | 0.9983 | 0.9989 | 0.9994 | 1.0000 | 1.0006 | 1.0012 | 1.0017 |
| Woodie | 0.9906 | 0.9933 | 0.9969 | 0.9996 | 1.0032 | 1.0059 | 1.0095 |
| Fibonacci | 0.9931 | 0.9955 | 0.9970 | 0.9994 | 1.0018 | 1.0033 | 1.0057 |
| Pivot points | S3 | S2 | S1 | PP | R1 | R2 | R3 |
|---|---|---|---|---|---|---|---|
| Standard | 0.9721 | 0.9786 | 0.9893 | 0.9958 | 1.0065 | 1.0130 | 1.0237 |
| Camarilla | 0.9953 | 0.9969 | 0.9984 | 1.0000 | 1.0016 | 1.0032 | 1.0047 |
| Woodie | 0.9742 | 0.9797 | 0.9914 | 0.9969 | 1.0086 | 1.0141 | 1.0258 |
| Fibonacci | 0.9786 | 0.9852 | 0.9892 | 0.9958 | 1.0024 | 1.0064 | 1.0130 |
Numerical data
The following is the status of technical indicators and moving averages registered at the time this technical analysis was created:
| RSI (14): | 42.63 | |
| MACD (12,26,9): | 0.0008 | |
| Directional Movement: | -6.9195 | |
| AROON (14): | 64.2857 | |
| DEMA (21): | 0.9947 | |
| Parabolic SAR (0,02-0,02-0,2): | 1.0023 | |
| Elder Ray (13): | -0.0037 | |
| Super Trend (3,10): | 0.9893 | |
| Zig ZAG (10): | 0.9898 | |
| VORTEX (21): | 1.0367 | |
| Stochastique (14,3,5): | 44.95 | |
| TEMA (21): | 0.9952 | |
| Williams %R (14): | -80.65 | |
| Chande Momentum Oscillator (20): | 0.0000 | |
| Repulse (5,40,3): | -0.9407 | |
| ROCnROLL: | 2 | |
| TRIX (15,9): | 0.0131 | |
| Courbe Coppock: | 0.72 |
| MA7: | 0.9961 | |
| MA20: | 0.9936 | |
| MA50: | 0.9930 | |
| MA100: | 0.9888 | |
| MAexp7: | 0.9943 | |
| MAexp20: | 0.9937 | |
| MAexp50: | 0.9923 | |
| MAexp100: | 0.9917 | |
| Price / MA7: | -0.69% | |
| Price / MA20: | -0.44% | |
| Price / MA50: | -0.38% | |
| Price / MA100: | +0.04% | |
| Price / MAexp7: | -0.51% | |
| Price / MAexp20: | -0.45% | |
| Price / MAexp50: | -0.31% | |
| Price / MAexp100: | -0.25% |
News
Don"t forget to follow the news on USD/CHF. At the time of publication of this analysis, the latest news was as follows:
-
 USDCHF May Be the Best Dollar-Bullish Option for Trade War Status Quo (Quick Take Video)
-
USDCHF - One of My Favorite Alternative Dollar Scenario Options
-
USD/CHF Price Forecast – Grinding Through Important Triple-Top Formation
-
U.S. stocks set for flat open, USD/CHF looks up
-
Chart Perspective – USD/CHF, EUR/GBP/JPY Cross-rates, DAX & More
About author

Online


Add a comment
Comments
0 comments on the analysis USD/CHF - Daily