USD/CHF - Daily - Technical analysis published on 03/19/2020 (GMT)
- Who voted?
- 199
- 0
Click here for a new analysis!
- Timeframe : Daily
- - Analysis generated on
- Status : TARGET REACHED
Summary of the analysis

Additional analysis
Quotes
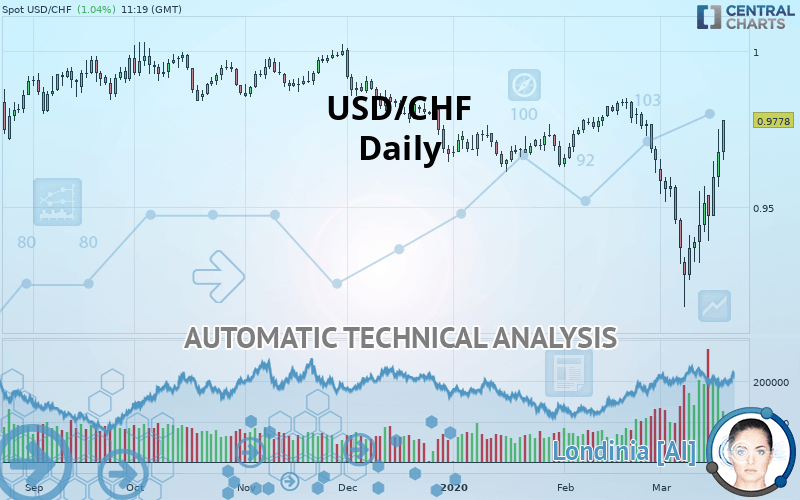
USD/CHF rating 0.9777 CHF. On the day, this instrument gained +1.03% and was between 0.9650 CHF and 0.9780 CHF. This implies that the price is at +1.32% from its lowest and at -0.03% from its highest.The Central Gaps scanner detects a bullish opening. A small advantage for buyers in the very short term.
Bullish opening
Type : Bullish
Timeframe : Openning
A study of price movements over other periods shows the following variations:
Near a new LOW record (5 years)
Type : Bearish
Timeframe : Weekly
Abnormal volumes on USD/CHF were detected by the Central Volumes scanner:
Abnormal volumes
Timeframe : 5 days
Technical
A technical analysis in Daily of this USD/CHF chart shows a slightly bullish trend. 57.14% of the signals given by moving averages are bullish. The slightly bullish signals given by short-term moving averages do not show a strengthening of this global trend. An assessment of moving averages reveals several bullish signals that could impact this trend:
Bullish trend reversal : adaptative moving average 50
Type : Bullish
Timeframe : Daily
Bullish price crossover with Moving Average 50
Type : Bullish
Timeframe : Daily
Bullish price crossover with adaptative moving average 50
Type : Bullish
Timeframe : Daily
In fact, 13 technical indicators on 18 studied are currently positioned bullish. Caution: the Central Indicators scanner currently detects an excess:
Williams %R indicator is overbought : over -20
Type : Neutral
Timeframe : Daily
Pivot points : price is over resistance 1
Type : Neutral
Timeframe : Daily
Pivot points : price is over resistance 1
Type : Neutral
Timeframe : Weekly
Momentum indicator is back over 0
Type : Bullish
Timeframe : Daily
An analysis of the price chart with the Central Patterns scanner (detector of chart patterns and resistances and supports) shows a result that can have an impact on the price change:
Resistance of channel is broken
Type : Bullish
Timeframe : Daily
No result was found by the Central Candlesticks scanner on Japanese candlesticks.
| S3 | S2 | S1 | Price | R1 | R2 | R3 | |
|---|---|---|---|---|---|---|---|
| ProTrendLines | 0.9441 | 0.9636 | 0.9691 | 0.9777 | 0.9780 | 0.9839 | 0.9916 |
| Change (%) | -3.44% | -1.44% | -0.88% | - | +0.03% | +0.63% | +1.42% |
| Change | -0.0336 | -0.0141 | -0.0086 | - | +0.0003 | +0.0062 | +0.0139 |
| Level | Intermediate | Intermediate | Major | - | Intermediate | Major | Intermediate |
Attention could also be paid to pivot points to set price objectives:
| Pivot points | S3 | S2 | S1 | PP | R1 | R2 | R3 |
|---|---|---|---|---|---|---|---|
| Standard | 0.9395 | 0.9480 | 0.9579 | 0.9664 | 0.9763 | 0.9848 | 0.9947 |
| Camarilla | 0.9626 | 0.9643 | 0.9660 | 0.9677 | 0.9694 | 0.9711 | 0.9728 |
| Woodie | 0.9401 | 0.9484 | 0.9585 | 0.9668 | 0.9769 | 0.9852 | 0.9953 |
| Fibonacci | 0.9480 | 0.9551 | 0.9594 | 0.9664 | 0.9735 | 0.9778 | 0.9848 |
| Pivot points | S3 | S2 | S1 | PP | R1 | R2 | R3 |
|---|---|---|---|---|---|---|---|
| Standard | 0.8888 | 0.9035 | 0.9275 | 0.9422 | 0.9662 | 0.9809 | 1.0049 |
| Camarilla | 0.9409 | 0.9444 | 0.9480 | 0.9515 | 0.9551 | 0.9586 | 0.9621 |
| Woodie | 0.8935 | 0.9058 | 0.9322 | 0.9445 | 0.9709 | 0.9832 | 1.0096 |
| Fibonacci | 0.9035 | 0.9183 | 0.9274 | 0.9422 | 0.9570 | 0.9661 | 0.9809 |
| Pivot points | S3 | S2 | S1 | PP | R1 | R2 | R3 |
|---|---|---|---|---|---|---|---|
| Standard | 0.9319 | 0.9464 | 0.9558 | 0.9703 | 0.9797 | 0.9942 | 1.0036 |
| Camarilla | 0.9585 | 0.9607 | 0.9629 | 0.9651 | 0.9673 | 0.9695 | 0.9717 |
| Woodie | 0.9293 | 0.9451 | 0.9532 | 0.9690 | 0.9771 | 0.9929 | 1.0010 |
| Fibonacci | 0.9464 | 0.9556 | 0.9612 | 0.9703 | 0.9795 | 0.9851 | 0.9942 |
Numerical data
The following are the details of the technical indicators and moving averages that were collected to generate this technical analysis:
| RSI (14): | 60.82 | |
| MACD (12,26,9): | -0.0030 | |
| Directional Movement: | 4.8235 | |
| AROON (14): | 57.1429 | |
| DEMA (21): | 0.9532 | |
| Parabolic SAR (0,02-0,02-0,2): | 0.9285 | |
| Elder Ray (13): | 0.0145 | |
| Super Trend (3,10): | 0.9335 | |
| Zig ZAG (10): | 0.9759 | |
| VORTEX (21): | 0.9153 | |
| Stochastique (14,3,5): | 85.11 | |
| TEMA (21): | 0.9539 | |
| Williams %R (14): | -3.51 | |
| Chande Momentum Oscillator (20): | 0.0201 | |
| Repulse (5,40,3): | 2.4755 | |
| ROCnROLL: | 1 | |
| TRIX (15,9): | -0.0968 | |
| Courbe Coppock: | 2.85 |
| MA7: | 0.9552 | |
| MA20: | 0.9575 | |
| MA50: | 0.9667 | |
| MA100: | 0.9760 | |
| MAexp7: | 0.9597 | |
| MAexp20: | 0.9584 | |
| MAexp50: | 0.9655 | |
| MAexp100: | 0.9726 | |
| Price / MA7: | +2.36% | |
| Price / MA20: | +2.11% | |
| Price / MA50: | +1.14% | |
| Price / MA100: | +0.17% | |
| Price / MAexp7: | +1.88% | |
| Price / MAexp20: | +2.01% | |
| Price / MAexp50: | +1.26% | |
| Price / MAexp100: | +0.52% |
News
Don"t forget to follow the news on USD/CHF. At the time of publication of this analysis, the latest news was as follows:
-
 USD/CHF Technical Analysis For March 19, 2020 by FX Empire
-
USD/CHF Technical Analysis For March 18, 2020 by FX Empire
-
USD/CHF Technical Analysis for March 17, 2020 by FX Empire
-
USD/CHF Technical Analysis for March 16, 2020 by FX Empire
-
USDCHF Technical Analysis for February 19, 2020 by FXEmpire
About author

Online


Add a comment
Comments
0 comments on the analysis USD/CHF - Daily