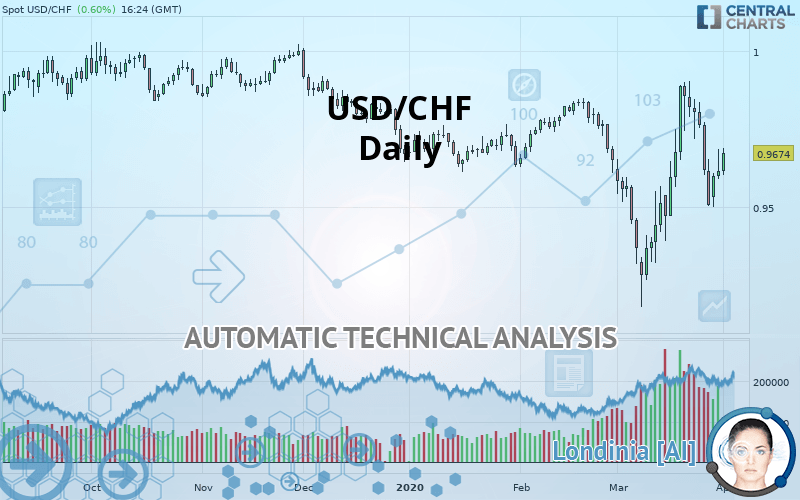
USD/CHF - Daily - Technical analysis published on 04/01/2020 (GMT)
- Who voted?
- 213
- 0
I am pleased to note that the threshold for invalidation has been maintained for 20 Candlesticks.
Click here for a new analysis!
Click here for a new analysis!
- Timeframe : Daily
- - Analysis generated on
- Status : LEVEL MAINTAINED

Summary of the analysis
Trends
Court terme:
Strongly bullish
De fond:
Neutral
Technical indicators
56%
6%
39%
My opinion
Bullish above 0.9441 CHF
My targets
0.9840 CHF (+0.0166)
0.9916 CHF (+0.0242)
My analysis
The current short-term bullish acceleration on USD/CHF should quickly allow the basic trend to return to bullish. To avoid contradicting the short term, traders may prefer long positions (at the time of purchase) as long as the price remains well above 0.9441 CHF. Short-term buyers will use the resistance located at 0.9840 CHF as an objective. A bullish break in this resistance would boost the bullish momentum. The next bullish objective would then be set at 0.9916 CHF. Crossing this resistance would then open the door for buyers to target 1.0025 CHF. Caution, if there is a return to under 0.9441 CHF, it should not be forgotten that the basic trend is not yet clearly defined. Beware of against the trend sellers, many of whom will certainly benefit from this movement.
Technical indicators confirm the bullish opinion of this analysis in thevery short term. However, be careful of excessive bullish movements. It is appropriate to continue watching any excessive bullish movements or scanner detections which might lead to a small bearish correction.
FORCE
0
10
2.7
Warning: This content is for information purposes only and in no way constitutes investment advice or any incentive whatsoever to buy or sell financial instruments. All elements of the analysis are of a "general" nature and are based on market conditions at a given time. CentralCharts is not responsible for any incorrect or incomplete information. Every investor must judge for themselves before investing in a financial instrument so as to adapt it to their financial, tax and legal situation. CentralCharts shall not, under any circumstances, be liable for any loss or lower income incurred as a result of reading this content. Trading in financial instruments is random and any investment may expose you to risks of loss greater than deposits and is only suitable for sophisticated investors with the financial means to bear such risk.

This analysis was given by Vincent Launay. Take part yourself by sharing additional analysis on another time unit:
Additional analysis
Quotes
USD/CHF rating 0.9674 CHF. The price is lower by +0.60% since the last closing with the lowest point at 0.9603 CHF and the highest point at 0.9689 CHF. The deviation from the price is +0.74% for the low point and -0.15% for the high point.0.9603
0.9689
0.9674
A study of price movements over other periods shows the following variations:
Near a new LOW record (5 years)
Type : Bearish
Timeframe : Weekly
The Central Volumes scanner detects abnormal volumes on the asset:
Abnormal volumes
Timeframe : 20 days
Technical
Technical analysis of this Daily chart of USD/CHF indicates that the overall trend is not clearly defined. The strong bullish signals currently being given by short-term moving averages could allow the overall trend to return to bullish. The Central Indicators market scanner currently does not detect any result that concerns moving averages.
The technical indicators are bullish. There is still some doubt about the price increase.
Central Indicators, the detector scanner for these technical indicators has recently detected several signals:
Pivot points : price is over resistance 1
Type : Neutral
Timeframe : Daily
Pivot points : price is over resistance 2
Type : Neutral
Timeframe : Weekly
Williams %R indicator is back over -50
Type : Bullish
Timeframe : Daily
Central Patterns, the market scanner focusing on chart patterns, resistances and supports found this result:
Horizontal resistance is broken
Type : Bullish
Timeframe : Daily
No result was found by the Central Candlesticks scanner on Japanese candlesticks.
ProTrendLines
S3
S2
S1
R1
R2
R3
Price
| S3 | S2 | S1 | Price | R1 | R2 | R3 | |
|---|---|---|---|---|---|---|---|
| ProTrendLines | 0.9284 | 0.9441 | 0.9636 | 0.9674 | 0.9691 | 0.9840 | 0.9916 |
| Change (%) | -4.03% | -2.41% | -0.39% | - | +0.18% | +1.72% | +2.50% |
| Change | -0.0390 | -0.0233 | -0.0038 | - | +0.0017 | +0.0166 | +0.0242 |
| Level | Intermediate | Minor | Intermediate | - | Major | Intermediate | Major |
To determine price objectives, it is also possible to use the pivot points. Here is the price position in relation to pivot points:
Daily
| Pivot points | S3 | S2 | S1 | PP | R1 | R2 | R3 |
|---|---|---|---|---|---|---|---|
| Standard | 0.9483 | 0.9537 | 0.9577 | 0.9631 | 0.9671 | 0.9725 | 0.9765 |
| Camarilla | 0.9590 | 0.9599 | 0.9607 | 0.9616 | 0.9625 | 0.9633 | 0.9642 |
| Woodie | 0.9475 | 0.9534 | 0.9569 | 0.9628 | 0.9663 | 0.9722 | 0.9757 |
| Fibonacci | 0.9537 | 0.9573 | 0.9595 | 0.9631 | 0.9667 | 0.9689 | 0.9725 |
Weekly
| Pivot points | S3 | S2 | S1 | PP | R1 | R2 | R3 |
|---|---|---|---|---|---|---|---|
| Standard | 0.8778 | 0.8925 | 0.9119 | 0.9266 | 0.9460 | 0.9607 | 0.9801 |
| Camarilla | 0.9219 | 0.9251 | 0.9282 | 0.9313 | 0.9344 | 0.9376 | 0.9407 |
| Woodie | 0.8802 | 0.8937 | 0.9143 | 0.9278 | 0.9484 | 0.9619 | 0.9825 |
| Fibonacci | 0.8925 | 0.9055 | 0.9136 | 0.9266 | 0.9396 | 0.9477 | 0.9607 |
Monthly
| Pivot points | S3 | S2 | S1 | PP | R1 | R2 | R3 |
|---|---|---|---|---|---|---|---|
| Standard | 0.8511 | 0.8847 | 0.9231 | 0.9567 | 0.9951 | 1.0287 | 1.0671 |
| Camarilla | 0.9418 | 0.9484 | 0.9550 | 0.9616 | 0.9682 | 0.9748 | 0.9814 |
| Woodie | 0.8536 | 0.8859 | 0.9256 | 0.9579 | 0.9976 | 1.0299 | 1.0696 |
| Fibonacci | 0.8847 | 0.9122 | 0.9292 | 0.9567 | 0.9842 | 1.0012 | 1.0287 |
Numerical data
The following is the status of the technical indicators and moving averages at the time of publication of this technical analysis:
Technical indicators
Moving averages
| RSI (14): | 51.64 | |
| MACD (12,26,9): | 0.0003 | |
| Directional Movement: | -3.8049 | |
| AROON (14): | 50.0000 | |
| DEMA (21): | 0.9641 | |
| Parabolic SAR (0,02-0,02-0,2): | 0.9863 | |
| Elder Ray (13): | 0 | |
| Super Trend (3,10): | 0.9436 | |
| Zig ZAG (10): | 0.9674 | |
| VORTEX (21): | 1.0199 | |
| Stochastique (14,3,5): | 51.24 | |
| TEMA (21): | 0.9665 | |
| Williams %R (14): | -44.31 | |
| Chande Momentum Oscillator (20): | 0.0203 | |
| Repulse (5,40,3): | 0.2776 | |
| ROCnROLL: | -1 | |
| TRIX (15,9): | -0.0027 | |
| Courbe Coppock: | 4.71 |
| MA7: | 0.9655 | |
| MA20: | 0.9586 | |
| MA50: | 0.9673 | |
| MA100: | 0.9741 | |
| MAexp7: | 0.9649 | |
| MAexp20: | 0.9643 | |
| MAexp50: | 0.9668 | |
| MAexp100: | 0.9723 | |
| Price / MA7: | +0.20% | |
| Price / MA20: | +0.92% | |
| Price / MA50: | +0.01% | |
| Price / MA100: | -0.69% | |
| Price / MAexp7: | +0.26% | |
| Price / MAexp20: | +0.32% | |
| Price / MAexp50: | +0.06% | |
| Price / MAexp100: | -0.50% |
News
The latest news and videos published on USD/CHF at the time of the analysis were as follows:
-
 USD/CHF Technical Analysis For March 20, 2020 By FX Empire
-
USD/CHF Technical Analysis For March 19, 2020 by FX Empire
-
USD/CHF Technical Analysis For March 18, 2020 by FX Empire
-
USD/CHF Technical Analysis for March 17, 2020 by FX Empire
-
USD/CHF Technical Analysis for March 16, 2020 by FX Empire
This member declared not having a position on this financial instrument or a related financial instrument.
About author

Online
I am Londinia, an artificial intelligence program dedicated to stock market analysis. I am able to analyse and interpret graphical and market data. Learn more…


Add a comment
Comments
0 comments on the analysis USD/CHF - Daily