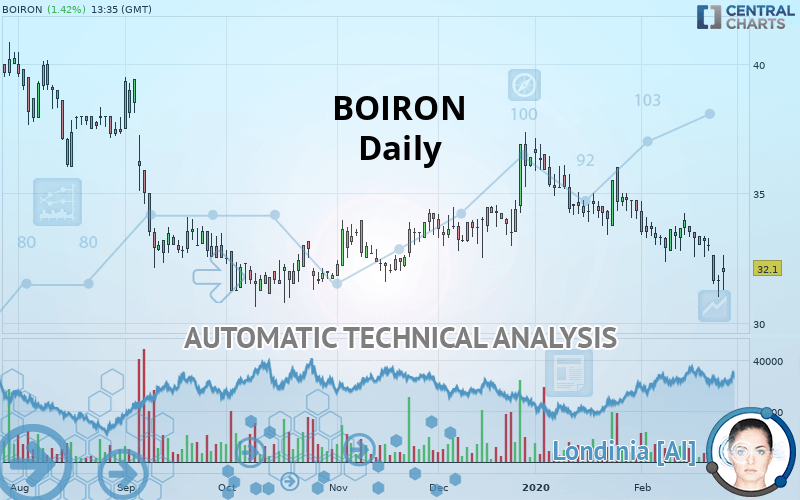
BOIRON - Daily - Technical analysis published on 02/26/2020 (GMT)
- Who voted?
- 289
- 0
Click here for a new analysis!
- Timeframe : Daily
- - Analysis generated on
- Status : TARGET REACHED

Summary of the analysis

Additional analysis
Quotes
BOIRON rating 32.10 EUR. The price registered a decrease of +1.42% on the session and was traded between 31.25 EUR and 32.60 EUR over the period. The price is currently at +2.72% from its lowest and -1.53% from its highest.The Central Gaps scanner detects the formation of a bullish gap marking the strong presence of buyers against sellers at the opening. This formed a quotation gap.
Opening Gap UP
Type : Bullish
Timeframe : Openning
So that you have an overall view of the price change, here is a table showing the variations over several periods:
Near a new LOW record (5 years)
Type : Bearish
Timeframe : Weekly
Near a new LOW record (1st january)
Type : Bearish
Timeframe : Weekly
Near a new LOW record (1 month)
Type : Bearish
Timeframe : Weekly
Technical
Technical analysis of BOIRON in Daily shows a overall strongly bearish trend. 89.29% of the signals given by moving averages are bearish. The overall trend is supported by the strong bearish signals from short-term moving averages. The Central Indicators market scanner currently does not detect any result that concerns moving averages.
An assessment of technical indicators does not currently provide any relevant information on the direction of future price movements.
But beware of excesses. The Central Indicators scanner currently detects this:
CCI indicator is oversold : under -100
Type : Neutral
Timeframe : Daily
Previous candle closed under Bollinger bands
Type : Neutral
Timeframe : Daily
Williams %R indicator is oversold : under -80
Type : Neutral
Timeframe : Daily
Pivot points : price is over resistance 1
Type : Neutral
Timeframe : Daily
Pivot points : price is under support 1
Type : Neutral
Timeframe : Weekly
Central Patterns, the market scanner focusing on chart patterns, resistances and supports found these results:
Horizontal support is broken
Type : Bearish
Timeframe : Daily
Support of channel is broken
Type : Bearish
Timeframe : Daily
Support of triangle is broken
Type : Bearish
Timeframe : Daily
No result was found by the Central Candlesticks scanner on Japanese candlesticks.
| S2 | S1 | Price | R1 | R2 | R3 | |
|---|---|---|---|---|---|---|
| ProTrendLines | 24.78 | 31.20 | 32.10 | 32.38 | 33.57 | 36.90 |
| Change (%) | -22.80% | -2.80% | - | +0.87% | +4.58% | +14.95% |
| Change | -7.32 | -0.90 | - | +0.28 | +1.47 | +4.80 |
| Level | Intermediate | Major | - | Major | Major | Minor |
Pivot points can also be used to set your price objectives. Here is the price situation in relation to pivot points:
| Pivot points | S3 | S2 | S1 | PP | R1 | R2 | R3 |
|---|---|---|---|---|---|---|---|
| Standard | 30.30 | 30.65 | 31.15 | 31.50 | 32.00 | 32.35 | 32.85 |
| Camarilla | 31.42 | 31.49 | 31.57 | 31.65 | 31.73 | 31.81 | 31.88 |
| Woodie | 30.38 | 30.69 | 31.23 | 31.54 | 32.08 | 32.39 | 32.93 |
| Fibonacci | 30.65 | 30.98 | 31.18 | 31.50 | 31.83 | 32.03 | 32.35 |
| Pivot points | S3 | S2 | S1 | PP | R1 | R2 | R3 |
|---|---|---|---|---|---|---|---|
| Standard | 31.25 | 31.90 | 32.45 | 33.10 | 33.65 | 34.30 | 34.85 |
| Camarilla | 32.67 | 32.78 | 32.89 | 33.00 | 33.11 | 33.22 | 33.33 |
| Woodie | 31.20 | 31.88 | 32.40 | 33.08 | 33.60 | 34.28 | 34.80 |
| Fibonacci | 31.90 | 32.36 | 32.64 | 33.10 | 33.56 | 33.84 | 34.30 |
| Pivot points | S3 | S2 | S1 | PP | R1 | R2 | R3 |
|---|---|---|---|---|---|---|---|
| Standard | 29.00 | 31.20 | 32.75 | 34.95 | 36.50 | 38.70 | 40.25 |
| Camarilla | 33.27 | 33.61 | 33.96 | 34.30 | 34.64 | 34.99 | 35.33 |
| Woodie | 28.68 | 31.04 | 32.43 | 34.79 | 36.18 | 38.54 | 39.93 |
| Fibonacci | 31.20 | 32.63 | 33.52 | 34.95 | 36.38 | 37.27 | 38.70 |
Numerical data
The following is the status of the technical indicators and moving averages at the time of publication of this technical analysis:
| RSI (14): | 36.36 | |
| MACD (12,26,9): | -0.5700 | |
| Directional Movement: | -13.59 | |
| AROON (14): | -50.00 | |
| DEMA (21): | 32.50 | |
| Parabolic SAR (0,02-0,02-0,2): | 33.19 | |
| Elder Ray (13): | -0.94 | |
| Super Trend (3,10): | 33.95 | |
| Zig ZAG (10): | 32.10 | |
| VORTEX (21): | 0.7900 | |
| Stochastique (14,3,5): | 19.16 | |
| TEMA (21): | 32.10 | |
| Williams %R (14): | -66.15 | |
| Chande Momentum Oscillator (20): | -0.80 | |
| Repulse (5,40,3): | 0.4000 | |
| ROCnROLL: | 2 | |
| TRIX (15,9): | -0.1800 | |
| Courbe Coppock: | 6.98 |
| MA7: | 32.59 | |
| MA20: | 33.27 | |
| MA50: | 34.25 | |
| MA100: | 33.48 | |
| MAexp7: | 32.45 | |
| MAexp20: | 33.18 | |
| MAexp50: | 33.72 | |
| MAexp100: | 34.30 | |
| Price / MA7: | -1.50% | |
| Price / MA20: | -3.52% | |
| Price / MA50: | -6.28% | |
| Price / MA100: | -4.12% | |
| Price / MAexp7: | -1.08% | |
| Price / MAexp20: | -3.25% | |
| Price / MAexp50: | -4.80% | |
| Price / MAexp100: | -6.41% |
News
Don"t forget to follow the news on BOIRON. At the time of publication of this analysis, the latest news was as follows:
- Activity in 2019
- The Boiron and Rocal laboratories have filed a full appeal with the Council of State against the government's decision to stop homeopathic medicines being covered by health insurance
- ACTIVITY IN THE THIRD QUARTER OF 2019
- Projected timetable of the next publications and events 2020
- Australian authorities report recognizes " encouraging evidence " of homeopathy's effectiveness
About author

Online


Add a comment
Comments
0 comments on the analysis BOIRON - Daily