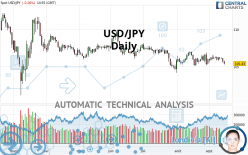
USD/JPY - Daily - Technical analysis published on 09/15/2020 (GMT)
- Who voted?
- 107
- 0
Click here for a new analysis!
- Timeframe : Daily
- - Analysis generated on
- Status : TARGET REACHED

Summary of the analysis

Additional analysis
Quotes
The USD/JPY rating is 105.43 JPY. On the day, this instrument lost -0.28% and was traded between 105.30 JPY and 105.82 JPY over the period. The price is currently at +0.12% from its lowest and -0.37% from its highest.So that you have an overall view of the price change, here is a table showing the variations over several periods:
Near a new LOW record (1st january)
Type : Bearish
Timeframe : Weekly
Technical
Technical analysis of this Daily chart of USD/JPY indicates that the overall trend is strongly bearish. 89.29% of the signals given by moving averages are bearish. This strongly bearish trend is showing signs of slowing down given the slightly bearish signals given by short-term moving averages. An assessment of moving averages reveals several bearish signals that could impact this trend:
Bearish trend reversal : adaptative moving average 20
Type : Bearish
Timeframe : Daily
Bearish price crossover with Moving Average 20
Type : Bearish
Timeframe : Daily
The technical indicators are generally neutral. They do not provide relevant information on the direction of future price movements.
Central Indicators, the detector scanner for these technical indicators has recently detected several signals:
Pivot points : price is under support 1
Type : Neutral
Timeframe : Daily
Pivot points : price is under support 3
Type : Neutral
Timeframe : Weekly
RSI indicator is back under 50
Type : Bearish
Timeframe : Daily
Parabolic SAR indicator bearish reversal
Type : Bearish
Timeframe : Daily
Momentum indicator is back under 0
Type : Bearish
Timeframe : Daily
Williams %R indicator is back under -50
Type : Bearish
Timeframe : Daily
The Central Patterns scanner, which studies chart patterns, resistances and supports, has identified these signals:
Near horizontal support
Type : Bullish
Timeframe : Daily
Support of channel is broken
Type : Bearish
Timeframe : Daily
Support of triangle is broken
Type : Bearish
Timeframe : Daily
The Central Candlesticks scanner which studies Japanese candlesticks did not detect anything.
| S3 | S2 | S1 | Price | R1 | R2 | R3 | |
|---|---|---|---|---|---|---|---|
| ProTrendLines | 87.29 | 103.11 | 104.72 | 105.43 | 106.23 | 108.19 | 109.56 |
| Change (%) | -17.21% | -2.20% | -0.67% | - | +0.76% | +2.62% | +3.92% |
| Change | -18.14 | -2.32 | -0.71 | - | +0.80 | +2.76 | +4.13 |
| Level | Minor | Major | Major | - | Intermediate | Intermediate | Major |
Attention could also be paid to pivot points to set price objectives:
| Pivot points | S3 | S2 | S1 | PP | R1 | R2 | R3 |
|---|---|---|---|---|---|---|---|
| Standard | 104.84 | 105.20 | 105.46 | 105.82 | 106.08 | 106.44 | 106.70 |
| Camarilla | 105.56 | 105.62 | 105.67 | 105.73 | 105.79 | 105.84 | 105.90 |
| Woodie | 104.80 | 105.18 | 105.42 | 105.80 | 106.04 | 106.42 | 106.66 |
| Fibonacci | 105.20 | 105.43 | 105.58 | 105.82 | 106.05 | 106.20 | 106.44 |
| Pivot points | S3 | S2 | S1 | PP | R1 | R2 | R3 |
|---|---|---|---|---|---|---|---|
| Standard | 105.24 | 105.51 | 105.84 | 106.11 | 106.44 | 106.71 | 107.04 |
| Camarilla | 106.00 | 106.05 | 106.11 | 106.16 | 106.22 | 106.27 | 106.33 |
| Woodie | 105.26 | 105.53 | 105.86 | 106.13 | 106.46 | 106.73 | 107.06 |
| Fibonacci | 105.51 | 105.74 | 105.88 | 106.11 | 106.34 | 106.48 | 106.71 |
| Pivot points | S3 | S2 | S1 | PP | R1 | R2 | R3 |
|---|---|---|---|---|---|---|---|
| Standard | 103.10 | 104.10 | 105.05 | 106.05 | 107.00 | 108.00 | 108.95 |
| Camarilla | 105.46 | 105.64 | 105.82 | 106.00 | 106.18 | 106.36 | 106.54 |
| Woodie | 103.08 | 104.09 | 105.03 | 106.04 | 106.98 | 107.99 | 108.93 |
| Fibonacci | 104.10 | 104.85 | 105.31 | 106.05 | 106.80 | 107.26 | 108.00 |
Numerical data
The following is the status of technical indicators and moving averages registered at the time this technical analysis was created:
| RSI (14): | 42.66 | |
| MACD (12,26,9): | -0.0900 | |
| Directional Movement: | -11.87 | |
| AROON (14): | 0 | |
| DEMA (21): | 105.89 | |
| Parabolic SAR (0,02-0,02-0,2): | 106.92 | |
| Elder Ray (13): | -0.41 | |
| Super Trend (3,10): | 104.85 | |
| Zig ZAG (10): | 105.43 | |
| VORTEX (21): | 0.9500 | |
| Stochastique (14,3,5): | 32.57 | |
| TEMA (21): | 105.93 | |
| Williams %R (14): | -88.00 | |
| Chande Momentum Oscillator (20): | 0.05 | |
| Repulse (5,40,3): | -0.6500 | |
| ROCnROLL: | 2 | |
| TRIX (15,9): | -0.0100 | |
| Courbe Coppock: | 0.04 |
| MA7: | 105.99 | |
| MA20: | 106.01 | |
| MA50: | 106.21 | |
| MA100: | 106.81 | |
| MAexp7: | 105.88 | |
| MAexp20: | 106.01 | |
| MAexp50: | 106.28 | |
| MAexp100: | 106.75 | |
| Price / MA7: | -0.53% | |
| Price / MA20: | -0.55% | |
| Price / MA50: | -0.73% | |
| Price / MA100: | -1.29% | |
| Price / MAexp7: | -0.43% | |
| Price / MAexp20: | -0.55% | |
| Price / MAexp50: | -0.80% | |
| Price / MAexp100: | -1.24% |
News
The latest news and videos published on USD/JPY at the time of the analysis were as follows:
-
 USD/JPY Technical Analysis For September 15, 2020 By FX Empire
-
USD/JPY Technical Analysis for September 15, 2020 by FXEmpire
-
USD/JPY Technical Analysis For September 14, 2020 By FX Empire
-
USD/JPY Technical Analysis for the Week of September 14, 2020 by FXEmpire
-
USD/JPY Technical Analysis for September 14, 2020 by FXEmpire
About author

Online


Add a comment
Comments
0 comments on the analysis USD/JPY - Daily